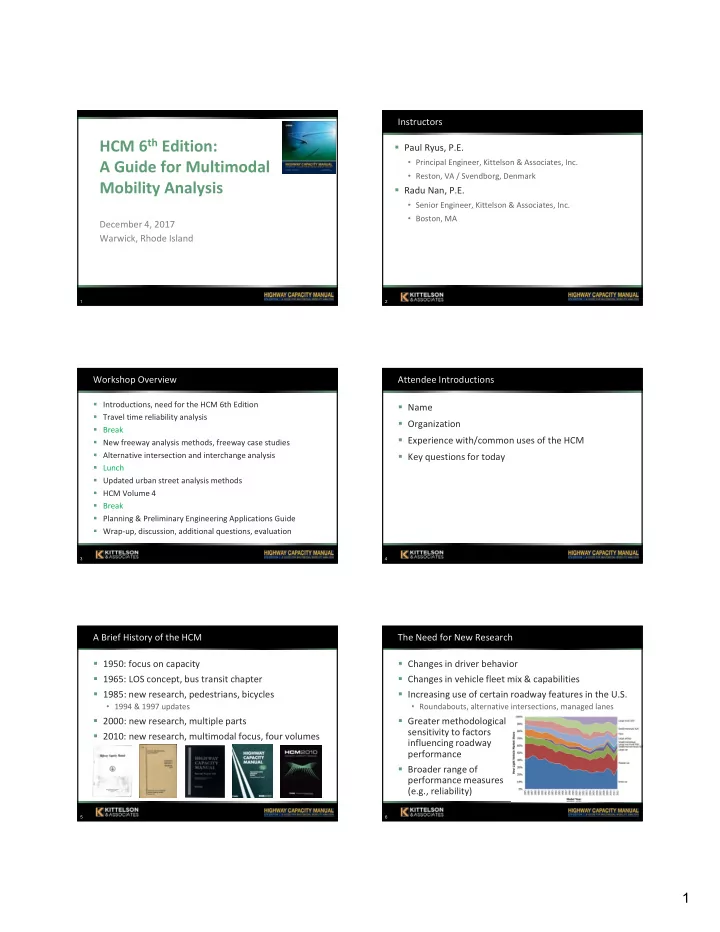
SLIDE 34 34
Evaluation Approach
- Divide the facility into “supersections” with similar
characteristics
- Use service volume tables to quickly screen out
portions of the corridor unlikely to have capacity problems
- Apply simplified version of the HCM freeway method
to evaluate remaining sections
199 200
Split Corridor Into Supersections
- Section on basis of:
- Significant change in demand volume
- Area type (urban, rural)
- Terrain (level, rolling, mountainous)
- Facility type (freeway, multilane hwy)
- Number of lanes
- Ideally, traversable in 15‐min free‐
flow travel time (15 miles @ 60 mph)
- Result: nine supersections ranging
from 3 to 13 miles in length
201
Use of Service Volume Tables for Screening
- Service volume tables give the maximum daily or
hourly volume that achieves a given LOS, for an assumed set of conditions
- Created by applying the HCM method multiple times
with different volume inputs
- In this example, supersections with AADTs exceeding
the LOS C service volume will be flagged for further analysis Example Service Volume Table
- Default values used for free‐flow speed, % trucks,
PHF, ramp density, lane width, K, and D for each combination of area type and terrain
- Case Study 1 in the Guide shows how to customize
the tables when some of these data are available
Adapted from Exhibits 19 and 30, NCHRP Report 825 202
Area Type Terrain Multilane Highway AADT (2‐way veh/day/ln) Freeway AADT (2‐way veh/day/ln) LOS A‐C LOS D LOS E (capacity) LOS A‐C LOS D LOS E (capacity) Urban Level 12,600 15,700 17,900 14,400 17,500 19,900 Urban Rolling 11,800 14,600 16,700 13,700 16,700 19,000 Rural Level 10,200 12,600 14,400 12,100 14,800 16,800 Rural Rolling 9,200 11,400 13,000 11,000 13,400 15,200 Rural Mountain 7,700 9,500 10,800 9,100 11,200 12,700
Your Turn
- The following data are available for each
supersection:
- Which supersections will operate at LOS A–C and can
be screened out of further analysis?
203
A B C D E F G H I Lanes, 2‐dir 4 4 4 4 6 4 4 4 4 Facility type Highway Freeway Freeway Freeway Highway Freeway Freeway Freeway Highway Area type Urban Urban Rural Urban Rural Urban Urban Urban Rural Terrain Level Level Level Level Mtn Level Rolling Level Level AADT, 2‐dir 57,600 63,500 70,100 55,800 44,500 54,700 52,800 32,400 19,500
Analysis Results
- Two‐thirds of the supersections are not expected to
have operational problems and do not need to be evaluated further
204
A B C D E F G H I Lanes, 2‐dir 4 4 4 4 6 4 4 4 4 Facility type Hwy Fwy Fwy Fwy Hwy Fwy Fwy Fwy Hwy Area type Urban Urban Rural Urban Rural Urban Urban Urban Rural Terrain Level Level Level Level Mtn Level Rolling Level Level AADT, 2‐dir 57,600 63,500 70,100 55,800 44,500 54,700 52,800 32,400 19,500 AADT/lane 14,400 15,875 17,525 13,950 7,415 13,675 13,200 8,100 4,875 LOS C service volume 12,600 14,400 12,100 14,400 7,700 14,400 13,700 14,400 12,100 Screen out?