
SLIDE 1
Supplemental Material Figure S-1: Diagram of the apparatus used to - - PDF document
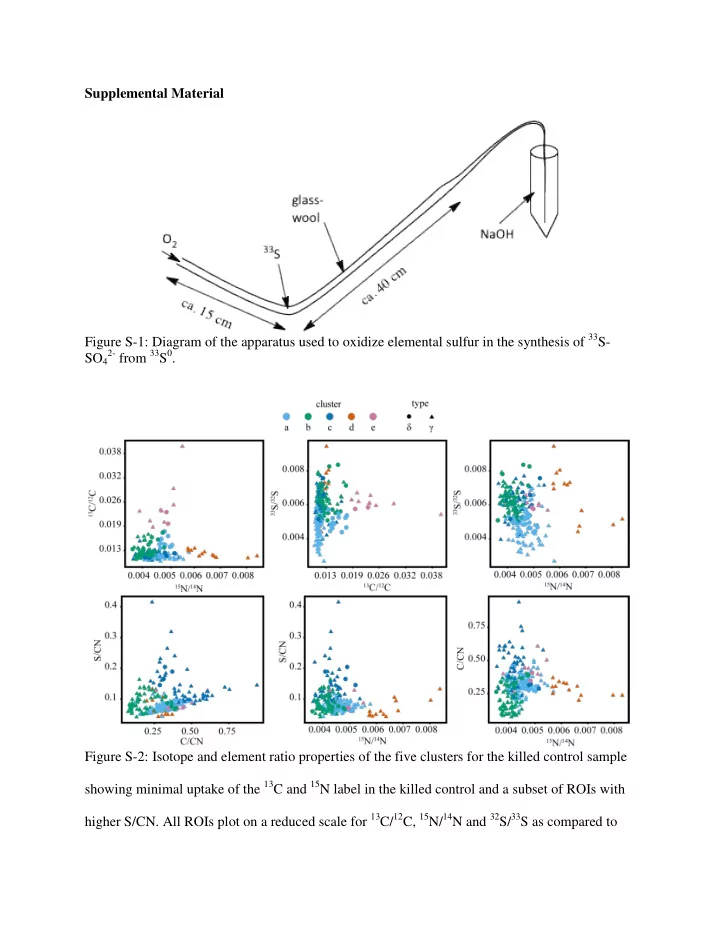
Supplemental Material Figure S-1: Diagram of the apparatus used to oxidize elemental sulfur in the synthesis of 33 S- 2- from 33 S 0 . SO 4 Figure S-2: Isotope and element ratio properties of the five clusters for the killed control sample showing