SLIDE 1
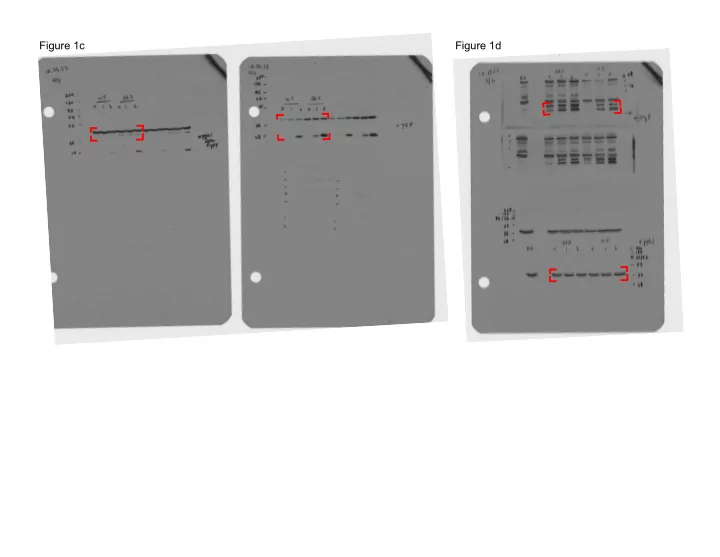
Figure 1c Figure 1d
SLIDE 2
Figure 1g
SLIDE 3
Figure 1f
SLIDE 4
Supplementary Figure 1c
SLIDE 5
Supplementary Figure 1g
SLIDE 6
SLIDE 7
Figure 5e, right panels. LC3
WT+Rap WT Con DDX6 ESC #2 WT+HBSS WT+RAP
Actin
WT+Rap WT Con DDX6 ESC #2 WT+HBSS WT+RAP
SQSTM1
WT Con DDX6 ESC #2 WT+HBSS WT+RAP WT Con DDX6 ESC #2 WT+HBSS WT+RAP
Actin
SLIDE 8
Figure 6h, right panels. SQSTM1 Actin GFP‐DDX6 Nat‐DDX6 Con Con+Rap DDX6 oe Con Con+Rap DDX6 oe Con Con+Rap DDX6 oe Con Con+Rap DDX6 oe
SLIDE 9
Control Patient Control Patient
SQSTM1 WB Actin WB
70 100 260 140 50 37 70 100 260 140 50 37
Dcp2‐ab WB pDcp2‐ab WB
Control Patient 70 100 260 140 50 37 70 100 260 140 50 37 Control Patient
For Figure 7f
SLIDE 10
260 140 70 50 100
Supp Fig. 7: In vitro mTor assay
Supp Fig. 7: In vitro mTor assay
Supp Fig.7:+CiAP‐phospho‐ Dcp2 Ab Supp Fig.7:+CiAP‐Dcp2 Ab Fig.4C:3XFLAG Dcp2 IP Supp.Fig.2b VAD1 Overexpression