Supplementary Figure 1. LNA-FISH analysis demonstrates increased - - PowerPoint PPT Presentation
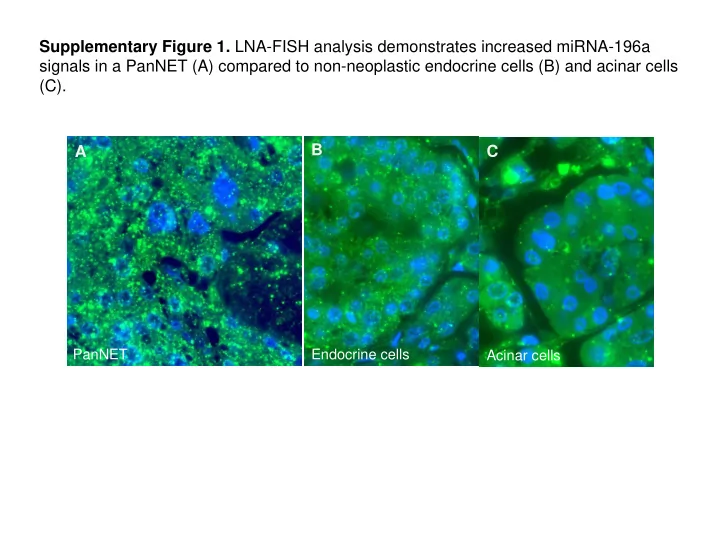
Supplementary Figure 1. LNA-FISH analysis demonstrates increased miRNA-196a signals in a PanNET (A) compared to non-neoplastic endocrine cells (B) and acinar cells (C). B A C PanNET Endocrine cells Acinar cells Supplementary Figure 2.
SLIDE 1
SLIDE 2
A
Supplementary Figure 2. Results of ROC analyses. High tumoral miRNA-196a levels significantly discriminated between recurrent and non-recurrent PanNETs with a cut-off level of 1.279 (A). miRNA-27b levels showed similar results but with a lower specificity (B), and miRNA-142–5p levels did not appear to significantly discriminate between recurrent and non-recurrent PanNETs (C). miR-27b
1-specificity sensitivity Cutoff value = 0.378 Sensitivity = 83.3% Specificity = 71.0% AUC = 0.747 P=0.058
miR-142-5p
sensitivity 1-specificity Cutoff value = 0.929 Sensitivity = 50.0% Specificity = 71.0% AUC= 0.543 P=0.742
miR-196a
sensitivity 1-specificity Cutoff value = 1.279 Sensitivity = 83.3% Specificity = 83.9% AUC= 0.833 P=0.011
SLIDE 3
Supplemental Digital Content 3. Cox regression analysis for the recurrence of PanNET
Crude Hazard Ratio Adjusted Hazard Ratio Variable
- n Univariable
Analysis 95% CI P
- n Multivariable
Analysis 95% CI P miR-27b* (low/high) 7.637 0.853-68.338 0.069 6.697 0.736-60.903 0.091 miR-142-5p* (low/high) 3.189 0.623-16.336 0.164 miR-196a* (low/high) 20.299 2.322-177.413 0.006 16.267 1.732-152.789 0.015 *Cut-off values for miR-27b (0.378), miR-142-5p (0.9285) and miR-196a (1.279) levels were derived from ROC curves.