SLIDE 1
Chapter 2
Signal Theory
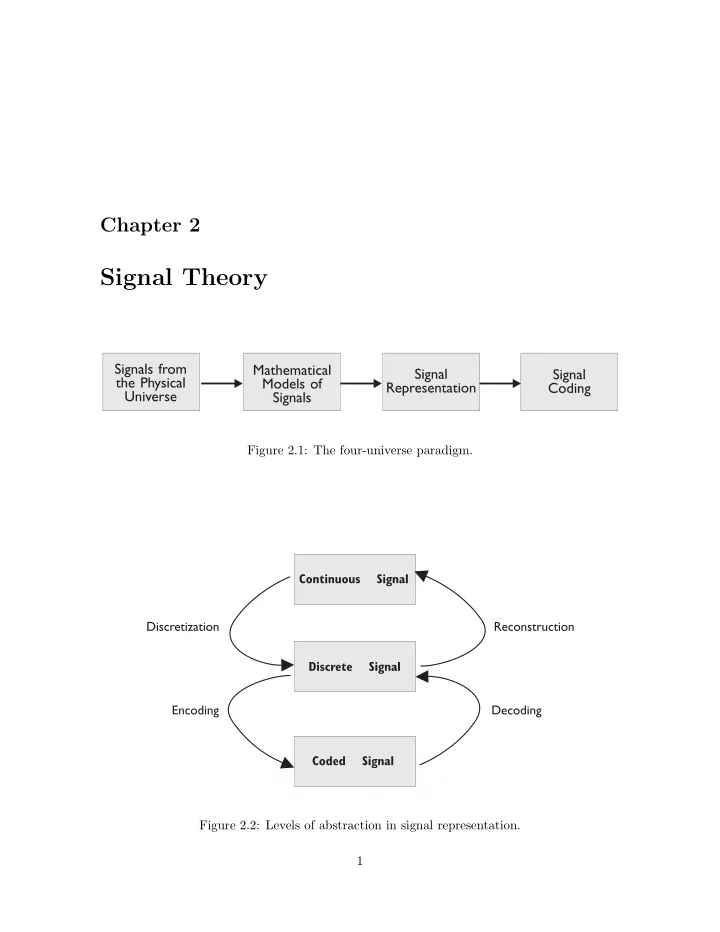
Figure 2.1: The four-universe paradigm. Figure 2.2: Levels of abstraction in signal representation. 1
SLIDE 2 2
CHAPTER 2. SIGNAL THEORY
Figure 2.3: The ε-neighborhood in the uniform metric. Figure 2.4: Sampling and reconstruction of a signal.
SLIDE 3
3 Figure 2.5: (a) 1-D pulse signal of duration 2a. (b) The two-dimensional analogue. Figure 2.6: A sequence of pulses converging toward an impulse at the origin.
SLIDE 4 4
CHAPTER 2. SIGNAL THEORY
Figure 2.7: Graphical representation of the impulse function. Figure 2.8: Sinusoidal signals with frequencies 2, 4, and 8. Figure 2.9: A periodic signal and two alternative frequency models for it.
SLIDE 5
5 Figure 2.10: A sawtooth signal in a spatial model (a) and frequency model (b) representation. Figure 2.11: The pulse signal and its Fourier transform. Figure 2.12: Distinct signals can have the same point sampling representation.
SLIDE 6 6
CHAPTER 2. SIGNAL THEORY
Figure 2.13: A partition of U. Figure 2.14: Transfer function for filters: (a) highpass; (b) lowpass; (c) bandpass; (d) band- stop.
SLIDE 7
7 Figure 2.15: One-dimensional ideal lowpass filter. Figure 2.16: Transfer function of ideal two-dimensional lowpass filters. Figure 2.17: Point sampling of a signal.
SLIDE 8 8
CHAPTER 2. SIGNAL THEORY
Figure 2.18: A plane lattice (lines are not part of the lattice). Figure 2.19: One-dimensional impulse train.
SLIDE 9
9 Figure 2.20: Product of the signal by an impulse train.
SLIDE 10 10
CHAPTER 2. SIGNAL THEORY
Figure 2.21: From an impulse train to a discrete signal. Figure 2.22: Train function in two dimensions. Figure 2.23: Convolution of a signal with a comb function.
SLIDE 11
11 Figure 2.24: Effect of sampling in the space domain and in the frequency domain. Figure 2.25: Sampling causes translates of the spectrum of a signal to be superimposed.
SLIDE 12 12
CHAPTER 2. SIGNAL THEORY
Figure 2.26: Frequency model of a sampled bandlimited signal. Figure 2.27: Graph of the sinc function in two dimensions. Figure 2.28: Convolution of a continuous signal with a discrete one.
SLIDE 13
13 Figure 2.29: Trapezoidal approximation of the integral. Figure 2.30: Periodic extension of the signal.