SLIDE 1
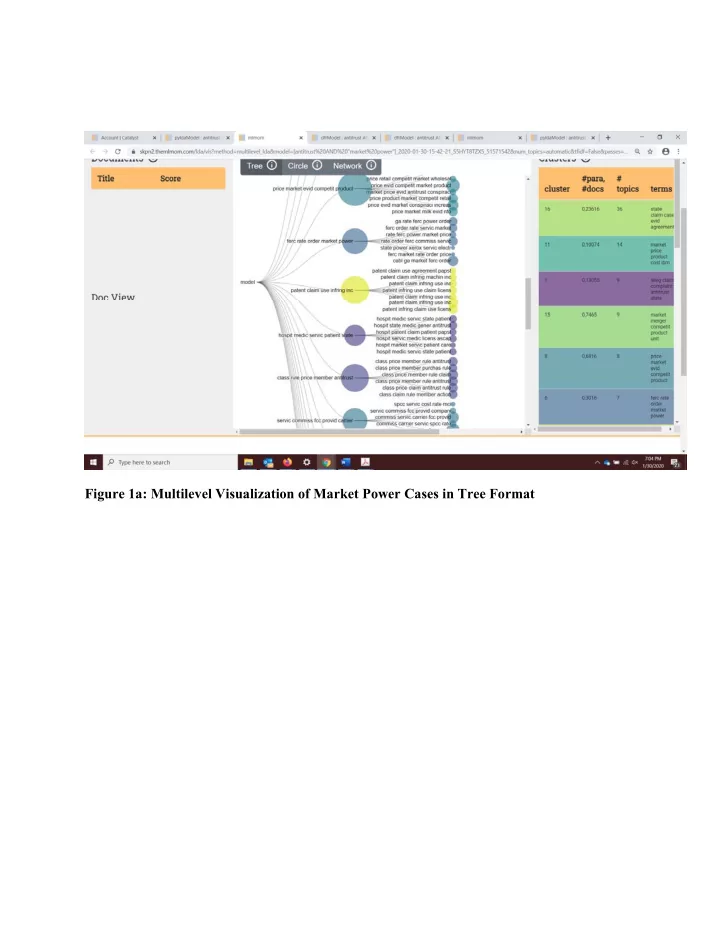
Figure 1a: Multilevel Visualization of Market Power Cases in Tree Format
SLIDE 2
Figure 1b: Multilevel Visualization of Market Power Cases in Circle Format
SLIDE 3
Figure 1c: Multilevel Visualization Showing the Recurrence of the Term “Market” Figure 1d: Multilevel Visualization of Market Power Cases in Network Format
SLIDE 4
Figure 2a: Topic Browser Visualization of Market Power Cases in List Format
SLIDE 5
Figure 2b: Breakdown of Terms and Cases within a Topic in Topic Browser View
SLIDE 6
Figure 2c: Recurrence of the Term “Relev” in Topic Browser View Figure 3: pyLDAvis View of Antitrust Cases Containing “Trinko”
SLIDE 7
Figure 4: Topic Browser Stacked View with Histogram of Market Power (top) and Regulation (bottom) Cases
SLIDE 8
SLIDE 9
Figure 5 (above): Multilevel Visualization of Market Power Cases
SLIDE 10
Figure 6: Multilevel Circle View with the Term “Agreement” Highlighted
SLIDE 11
SLIDE 12
Figure 8: Topic Browser View of Topics Containing “Effect”