SLIDE 1
Supplementary Information
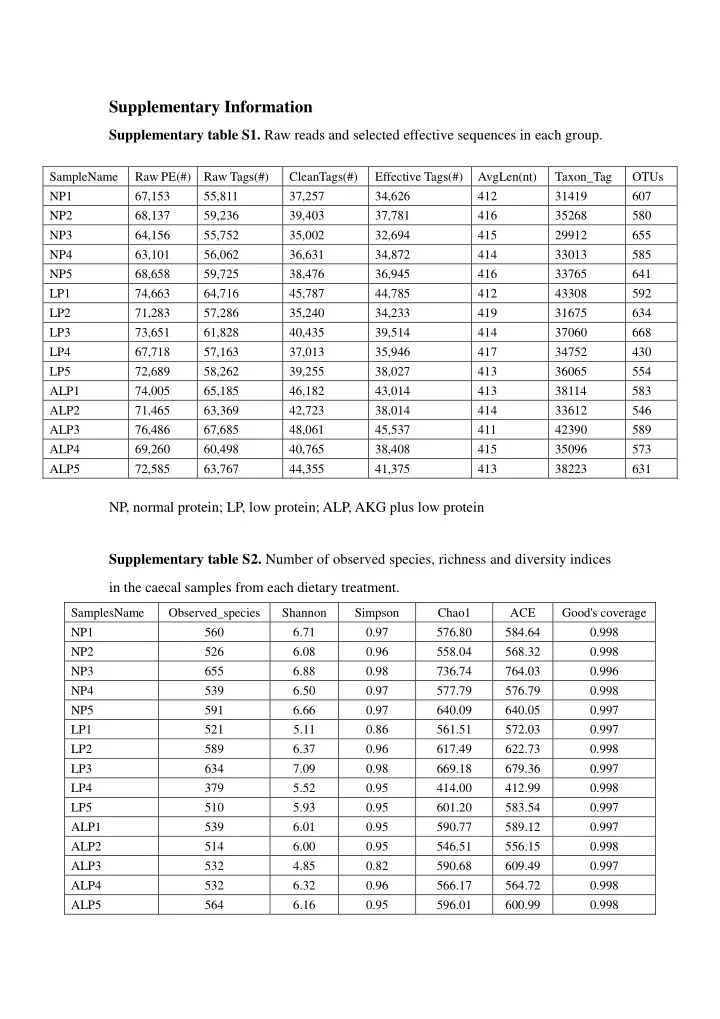
Supplementary table S1. Raw reads and selected effective sequences in each group. NP, normal protein; LP, low protein; ALP, AKG plus low protein Supplementary table S2. Number of observed species, richness and diversity indices in the caecal samples from each dietary treatment.
SampleName Raw PE(#) Raw Tags(#) CleanTags(#) Effective Tags(#) AvgLen(nt) Taxon_Tag OTUs NP1 67,153 55,811 37,257 34,626 412 31419 607 NP2 68,137 59,236 39,403 37,781 416 35268 580 NP3 64,156 55,752 35,002 32,694 415 29912 655 NP4 63,101 56,062 36,631 34,872 414 33013 585 NP5 68,658 59,725 38,476 36,945 416 33765 641 LP1 74,663 64,716 45,787 44,785 412 43308 592 LP2 71,283 57,286 35,240 34,233 419 31675 634 LP3 73,651 61,828 40,435 39,514 414 37060 668 LP4 67,718 57,163 37,013 35,946 417 34752 430 LP5 72,689 58,262 39,255 38,027 413 36065 554 ALP1 74,005 65,185 46,182 43,014 413 38114 583 ALP2 71,465 63,369 42,723 38,014 414 33612 546 ALP3 76,486 67,685 48,061 45,537 411 42390 589 ALP4 69,260 60,498 40,765 38,408 415 35096 573 ALP5 72,585 63,767 44,355 41,375 413 38223 631 SamplesName Observed_species Shannon Simpson Chao1 ACE Good's coverage NP1 560 6.71 0.97 576.80 584.64 0.998 NP2 526 6.08 0.96 558.04 568.32 0.998 NP3 655 6.88 0.98 736.74 764.03 0.996 NP4 539 6.50 0.97 577.79 576.79 0.998 NP5 591 6.66 0.97 640.09 640.05 0.997 LP1 521 5.11 0.86 561.51 572.03 0.997 LP2 589 6.37 0.96 617.49 622.73 0.998 LP3 634 7.09 0.98 669.18 679.36 0.997 LP4 379 5.52 0.95 414.00 412.99 0.998 LP5 510 5.93 0.95 601.20 583.54 0.997 ALP1 539 6.01 0.95 590.77 589.12 0.997 ALP2 514 6.00 0.95 546.51 556.15 0.998 ALP3 532 4.85 0.82 590.68 609.49 0.997 ALP4 532 6.32 0.96 566.17 564.72 0.998 ALP5 564 6.16 0.95 596.01 600.99 0.998
SLIDE 2
Supplementary table S3. Sequences of primers and probes used for group-specific quantitative PCR.
Bacterial group/species Sequences of primers and probes (5′ to 3′) Sources Oribacterium Forward Reverse GCGGCGTGCCTAACACATGC GenBank: HM120211.1 TTCACCCCAGTCATCAGTCCTGC Phascolarctobacterium Forward Reverse GGC GGC TTA ATA AGT CGA GC Wu et al., 2017 [10] CGT TCG CTA CCC TGG CTT TC Lachnospiraceae Forward Reverse Probe TTC GCAAGA ATG AAA CTC AAA AAG GAAAGA TCC GGT TAA GGA TC Newton et al., 2011[11] (6-FAM)-ACC AAG TCT TGA CAT CCG-(MGB)
SLIDE 3
Supplementary Figure S1. Difference analysis of alpha diversity index among NP, LP and ALP groups. NP, normal protein; LP, low protein; ALP, AKG plus low protein
SLIDE 4
Supplementary Figure S2. Comparison of Oribacterium, Phascolarctobacterium and Lachnospiraceae in cecum among dietary treatments, using real-time PCR analysis. NP, normal protein; LP, low protein; ALP, AKG plus low protein. For each bacterial group, bars not labeled with same letters indicate values are significantly different at P<0.05.
C e c a l g e n e c o p ie s lo g (g e n e c o p ie s )/g c o n te n t
O rib a c te riu m P h a s c o la rc to b a c te riu m L a c h n o s p ira c e a e 2 4 6 8
N P L P A L P
a b c a b a b a b a b
SLIDE 5 Supplementary Methods
DNA Extraction and PCR Amplification. Total genomic DNA was isolated from the samples of cecal digesta by using QIAamp DNA Stool Mini Kits according to the manufacturer's instructions. The concentration
- f the extracted DNA was determined with the NanoDrop-1000 Spectrophotometer
(NanoDrop Technologies Inc., Wilmington, DE, USA), DNA purity was monitored on 1% agarose gels. According to the concentration, DNA was diluted to 1ng/μL using sterile water, and was stored at -80℃ before further analysis. Sequencing was performed at Novogene Bioinformatics Technology Co. Ltd., Beijing,
- China. The PCR amplifications were conducted with the barcoded primer pair
341f/806r set, which amplifies the V3–V4 fragments of the 16S rDNA gene (341F:CCTAYGGGRBGCASCAG, 806R: GGACTACNNGGGTATCTAAT) ( Muyzer et al., 2013; Caporaso et al., 2011). PCR reactions were performed in a volume
- f 30 μL containing 12 μL sterile water, 1.0 μL DNA template, 1.0 μL of each primer,
and 15 μL 2× Phusion Master Mix (New England Biolabs, USA). The PCR cycle conditions were as follows: initial denaturation at 98 °C for 1 min, followed by 30 cycles at 98 °C for 10 s, 50 °C for 30 s, and 72 °C for 30 s, and a final extension step at 72 °C for 5 min. Resulting amplicons were confirmed on 2% agarose gels containing ethidium bromide.. All amplicons were in the size range of 400–450 bp, and were purified using a GeneJET Gel Extraction Kit (Thermo Fisher Scientific, Carlsbad, CA, USA). Following quantitation, equal concentrations of the purified amplicons were combined into a single tube. Sequencing libraries were generated using a NEB Next Ultra DNA Library Prep Kit for Illumina (New England Biolabs, Ipswich, MA, USA) following manufacturer’s recommendations, and index codes were added. The library quality was assessed on a Qubit @ 2.0 Fluorometer (Thermo Fisher Scientific, Carlsbad, CA, USA) and Agilent Bioanalyzer 2100 system. At last, the library was sequenced on an IlluminaHiSeq2500 platform and 250 bp paired-end. reads were generated. Bioinformatics analysis
SLIDE 6
Paired-end reads was assigned to samples based on their unique barcode and truncated by cutting off the barcode and primer sequence. Paired-end reads were merged using FLASH (V1.2.7,http://ccb.jhu.edu/software/FLASH/) [1],a very fast and accurate analysis tool, which was designed to merge paired-end reads when at least some of the reads overlap the read generated from the opposite end of the same DNA fragment, and the splicing sequences were called raw tags. The tags were compared with the reference database (Gold database, http://drive5.com/uchime/uchime_download.html)using UCHIME algorithm (UCHIME Algorithm, http://www.drive5.com/usearch/manual/uchime_algo.html) [4] to detect chimera sequences, and then the chimera sequences were removed [5]. Then the Effective Tags finally obtained. Sequences analysis were performed by Uparse software (Uparse v7.0.1001,http://drive5.com/uparse/) [6]. Sequences with ≥97% similarity were assigned to the same OTUs. Representative sequence for each OTU was screened for further annotation. For each representative sequence, the GreenGene Database 3(http://greengenes.lbl.gov) [7] was used based on RDP classifier(Version 2.2, http://sourceforge.net/projects/rdp-classifier/)[8]algorithmto annotate taxonomic information. In order to study phylogenetic relationship of different OTUs, and the difference of the dominant species in different samples(groups), multiple sequence alignment were conducted using the MUSCLE software (Version 3.8.31 , http://www.drive5.com/muscle/)[9]. OTUs abundance information were normalized using a standard of sequence number corresponding to the sample with the least sequences. Alpha diversity is applied in analyzing complexity of species diversity for a sample through 6 indices, including Observed-species, Chao1, Shannon, Simpson, ACE, Good-coverage. All this indices in our samples were calculated with QIIME (Version 1.7.0) and displayed with R software (Version 2.15.3). Beta diversity analysis was used to evaluate differences of samples in species complexity, Beta diversity on both weighted and unweighted unifrac were calculated by QIIME software (Version 1.7.0). Unweighted Pair-group Method with Arithmetic Means (UPGMA) Clustering was
SLIDE 7 performed as a type of hierarchical clustering method to interpret the distance matrix using average linkage and was conducted by QIIME software (Version 1.7.0). Real-time polymerase chain reaction analysis
Oribacterium, Phascolarctobacterium and Lachnospiraceae. Total bacterial DNAs were extracted from the contents of each intestinal sample (0.2 g) according to a previously described protocol (Kraler et al., 2016)[12], using a commercially available QIAamp DNA Stool Mini Kit (Qiagen, Hilden, Germany). Those extracts were stored at –80°C. They were then quantified on a Nanodrop 2000 Spectrophotometer (Thermo Scientific, Courtaboeuf, France) before the results were adjusted to a concentration of 10 ng μL-1. Methods based on 16S rRNA were used to assess the abundances of Oribacterium, Phascolarctobacterium and Lachnospiraceae, as described previously (Kong et al., 2014; Fleury et al., 2016)[13-14] . All PCR primers used in this study are listed in Supplementary table S3. The qPCR protocol for assaying Lachnospiraceae included 0.3 μM of each primer and 0.1 μM of probe, while those reactions for Oribacterium and Phascolarctobacterium used a concentration of 0.4 μM of each primer. The amplification program entailed 95°C for 30 s; followed by 40 cycles of 95°C for 5 s and 60°C for 30 s; and then a final melting-curve for SYBR Green tests. The melting curve analysis and size- determination of amplificates on agarose gels verified that the target fragments had been amplified. Standard curves were generated as described by Qi et al. (2011) [15]. For each sample and each bacterial group, results were expressed in log10 copies of 16S rRNA genes per g of intestinal content material (Metzlerzebeli et al., 2015)[16]. Reference [1] Magoč T, Salzberg S L. FLASH: fast length adjustment of short reads to improve genome assemblies. Bioinformatics 27.21 (2011): 2957-2963. [2] Bokulich, Nicholas A., et al. Quality-filtering vastly improves diversity estimates
SLIDE 8 from Illuminaamplicon sequencing. Nature methods 10.1 (2013): 57-59. [3] Caporaso, J. Gregory, et al. QIIME allows analysis of high-throughput community sequencing data. Nature methods 7.5 (2010): 335-336. [4] Edgar, Robert C., et al. UCHIME improves sensitivity and speed of chimera
- detection. Bioinformatics 27.16 (2011): 2194-2200.
[5] Haas, Brian J., et al. Chimeric 16S rRNA sequence formation and detection in Sanger and 454-pyrosequenced PCR amplicons.Genome research 21.3 (2011): 494-504. [6] Edgar, Robert C. UPARSE: highly accurate OTU sequences from microbial amplicon reads. Nature methods 10.10 (2013): 996-998. [7] DeSantis, Todd Z., et al. Greengenes, a chimera-checked 16S rRNA gene database and workbench compatible with ARB. Applied and environmental microbiology 72.7 (2006): 5069-5072. [8] Wang, Qiong, et al. Naive Bayesian classifier for rapid assignment of rRNA sequences into the new bacterial taxonomy. Applied and environmental microbiology 73.16 (2007): 5261-5267. [9] Edgar R C. MUSCLE: multiple sequence alignment with high accuracy and high
- throughput. Nucleic acids research32.5 (2004): 1792-1797.
[10] Wu F, Guo X, Zhang J, et al. Phascolarctobacterium faecium abundant colonization in human gastrointestinal tract[J]. Experimental & Therapeutic Medicine, 2017, 14(4):3122. [11] Newton R J, Vandewalle J L, Borchardt M A, et al. Lachnospiraceae and Bacteroidales alternative fecal indicators reveal chronic human sewage contamination in an urban harbor[J]. Applied & Environmental Microbiology, 2011, 77(19):6972-6981. [12] Kraler, M., Ghanbari, M., Domig, K.J., Schedle, K., Kneifel, W. (2016). The intestinal microbiota of piglets fed with wheat bran variants as characterised by 16S rRNA next-generation amplicon sequencing. Arch. Anim. Nutr. 70, 173-189. [13] Kong, X.F., Zhou, X.L., Lian, G.Q., Blachier, F., Liu, G., Tan, B.E., et al. (2014).
SLIDE 9 Dietary supplementation with chitooligosaccharides alters gut microbiota and modifies intestinal luminal metabolites in weaned Huanjiang mini-piglets. Livest.
[14] Fleury, M.A., Jouy, E., Eono, F., Cariolet, R., Couet, W., Gobin, P., et al. (2016). Impact of two different colistin dosing strategies on healthy piglet fecal microbiota.
- Res. Vet. Sci. 107, 152-160.
[15] Qi, H., Xiang, Z., Han, G., Yu, B., Huang, Z., Chen, D. (2011). Effects of different dietary protein sources on cecal microflora in rats. Afr. J. Biotechnol. 10, 3704-
- 3708. doi: 10.5897/AJB10.2677.
[16] Metzlerzebeli, B.U., Schmitzesser, S., Mann, E., Grüll, D., Molnar, T., Zebeli, Q. (2015). Adaptation of the cecal bacterial microbiome of growing pigs in response to resistant starch type 4. Appl. Environ. Microbiol. 81, 8489-8499. doi: 10.1128/AEM.02756-15.