SLIDE 1
Supplementary information BP 4Q05 results and strategy presentation
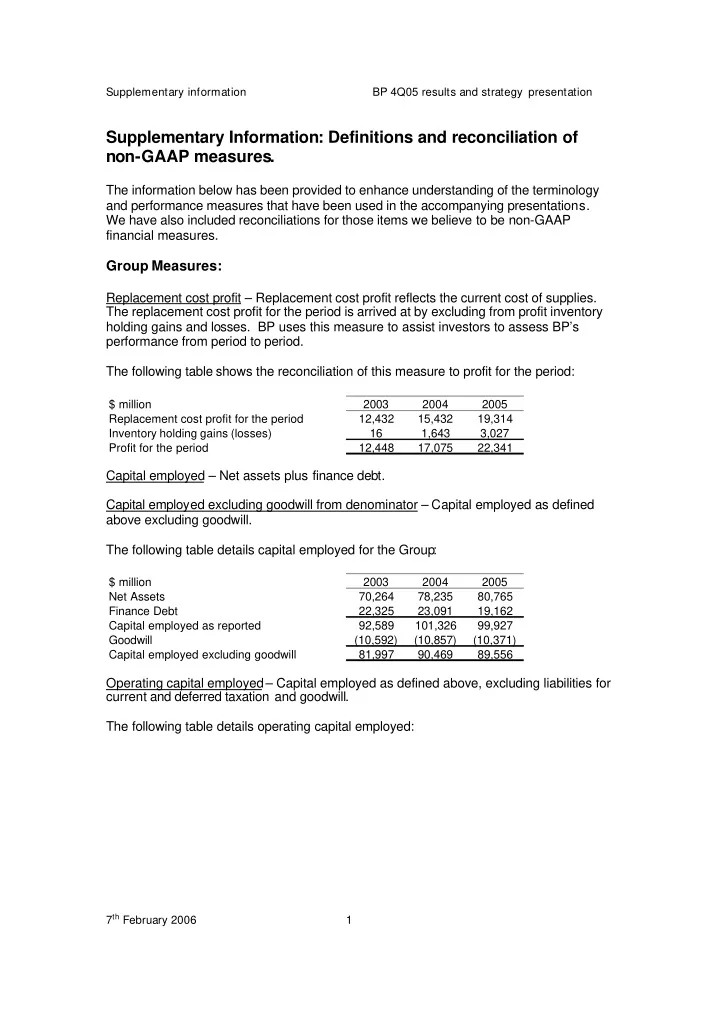
Supplementary Information: Definitions and reconciliation of non-GAAP measures.
The information below has been provided to enhance understanding of the terminology and performance measures that have been used in the accompanying presentations. We have also included reconciliations for those items we believe to be non-GAAP financial measures.
Group Measures:
Replacement cost profit – Replacement cost profit reflects the current cost of supplies. The replacement cost profit for the period is arrived at by excluding from profit inventory holding gains and losses. BP uses this measure to assist investors to assess BP’s performance from period to period. The following table shows the reconciliation of this measure to profit for the period:
$ million 2003 2004 2005 Replacement cost profit for the period 12,432 15,432 19,314 Inventory holding gains (losses) 16 1,643 3,027 Profit for the period 12,448 17,075 22,341
Capital employed – Net assets plus finance debt. Capital employed excluding goodwill from denominator – Capital employed as defined above excluding goodwill. The following table details capital employed for the Group:
$ million 2003 2004 2005 Net Assets 70,264 78,235 80,765 Finance Debt 22,325 23,091 19,162 Capital employed as reported 92,589 101,326 99,927 Goodwill (10,592) (10,857) (10,371) Capital employed excluding goodwill 81,997 90,469 89,556
Operating capital employed– Capital employed as defined above, excluding liabilities for current and deferred taxation and goodwill. The following table details operating capital employed:
7th February 2006 1
SLIDE 2
Supplementary information BP 4Q05 results and strategy presentation $ million 2003 2004 2005 Exploration and Production 59,352 65,223 68,721 Refining and Marketing 34,251 38,262 39,669 Gas, Power and Renewables 4,225 4,829 5,051 Other businesses and corporate 3,930 3,379 (2,602) Consolidation adjustment (361) (552) (778) Operating capital employed 101,397 111,141 110,061 Liabilities for current and deferred taxation (19,400) (20,672) (20,505) Goodwill 10,592 10,857 10,371 Capital employed 92,589 101,326 99,927
Return on average capital employed – reported (headline) basis Numerator –Replacement cost profit for the period plus minority interest plus interest post tax. Denominator – Average capital employed. Capital employed is defined above. Underlying return on average capital excluding goodwill Numerator –Replacement cost profit for the period plus minority interest plus interest post tax plus non-operating items Denominator – Average capital employed excluding goodwill from the denominator
7th February 2006 2
SLIDE 3 Supplementary information BP 4Q05 results and strategy presentation
The table below reconciles return on average capital employed based on profit for the period and using reported capital employed to return on average capital employed based
- n replacement cost profit, adjusted for non-operating items and using capital employed
excluding goodwill from the denominator. A guide to the calculation of comparative metrics for competitors is provided separately on bp.com.
UK GAAP (a) $ million 2000 2001 2002 2003 2004 Numerator Profit the period attributable to BP shareholders 6,556 6,795 12,448 17,075 Interest (b) 798 602 333 286 Minority interest 61 77 170 187 Adjusted profit for the period 7,415 7,474 12,951 17,548 Inventory holding (gains) losses 1,900 (1,129) (16) (1,643) Adjusted replacement cost profit 9,315 6,345 12,935 15,905 Non-operating items (post-tax) 299 642 234 1,072 Numerator excluding non-operating items 9,614 6,987 13,169 16,977 Denominator Capital employed as reported 87,200 87,158 86,480 92,589 101,326 Goodwill (12,198) (10,868) (10,438) (10,592) (10,857) Capital employed excluding goodwill 75,002 76,290 76,042 81,997 90,469 Average capital employed as reported (c) 87,179 86,819 87,732 96,958 Average capital employed excluding goodwill 75,646 76,166 77,216 86,233 Return on average capital employed
- Adjusted profit for the period/ACE as reported
9% 9% 15% 18%
- Adjusted RC profit/ACE as reported
11% 7% 15% 16%
- Adjusted RC profit excluding NOIs/ACE excluding goodwill
13% 9% 17% 20% Calculation of 2005 ROACE (d) Numerator 1 Jan 2005 1Q 2Q 3Q 4Q 2005 Profit the period attributable to BP shareholders 6,602 5,591 6,463 3,685 Interest (b) 112 83 94 112 Minority interest 61 69 68 93 Adjusted profit for the period 6,775 5,743 6,625 3,890 Inventory holding (gains) losses (1,111) (610) (2,053) 747 Adjusted replacement cost profit 5,664 5,133 4,572 4,637 Non-operating items (post-tax) (542) 822 921 553 Numerator excluding non-operating items 5,122 5,955 5,493 5,190 Denominator Capital employed as reported (e) 101,230 99,475 99,399 104,885 99,927 Goodwill (10,857) (10,754) (10,555) (10,440) (10,371) Capital employed excluding goodwill 90,373 88,721 88,844 94,445 89,556 Average capital employed as reported 100,353 99,437 102,142 102,406 Average capital employed excluding goodwill 89,547 88,783 91,645 92,001 Return on average capital employed
- Adjusted profit for the period/ACE as reported
27% 23% 26% 15% 23%
- Adjusted RC profit/ACE as reported
23% 21% 18% 18% 20%
- Adjusted RC profit excluding NOIs/ACE excluding goodwill
23% 27% 24% 23% 24%
(a) Financial Information for 2001 and 2002 has not been restated for IFRS. The UK GAAP information for 2002 reflects the adoption of Financial Reporting Standard No.17 'Retirement Benefits' (FRS 17) with effect from 1 January 2004. Financial information for 2001 has not been restated.
(b) Excludes interest on jointly controlled entities' and associates' debt and is on a post-tax basis using a deemed rate equal to the US statutory tax rate. (c) Opening capital employed at 1 January 2003 was $82,875 subsequent to the adoption of IFRS. (d) As a result of the Innovene disposal occuring on 16 December 2005, ROACE for 2005 has been calculated as the average of the four discrete
quarterly returns during 2005.
(e) Opening capital employed at 1 January 2005 was $101,230 subsequent to the adoption of IAS 39 on 1 January 2005
7th February 2006 3
SLIDE 4 Supplementary information BP 4Q05 results and strategy presentation
Organic capital expenditure (Organic Capex) – Capital expenditure excluding acquisitions and asset exchanges. See table under ‘Reinvestment ratio’ below. Inorganic capital expenditure– expenditure on acquisitions. Reinvestment ratio – Organic capital expenditure divided by net cash provided by
The following table details the calculation of the reinvestment ratio:
UK GAAP (a) $ million 2001 2002 2003 2004 2005 Capital expenditure and acquisitions 14,091 19,093 19,623 16,651 14,149 Less acquisitions and asset exchanges (924) (5,790) (6,026) (2,841) (211) Organic capital expenditure (b) 13,167 13,303 13,597 13,810 13,938 Cash Flow from operations 17,487 15,943 16,303 23,378 26,721 Reinvestment Ratio 75% 83% 83% 59% 52%
(a) Financial Information for 2001 and 2002 has not been restated for IFRS. The UK GAAP information for
2002 reflects the adoption of Financial Reporting Standard No.17 'Retirement Benefits' (FRS 17) with effect from 1 January 2004. Financial information for 2001 has not been restated.
(b) Reported capital expenditure is that incurred by BP group entities and does not include capital
expenditure incurred by equity-accounted entities.
Net debt ratio – Ratio of net debt (finance debt less cash and cash equivalents) to net debt plus equity. The table below presents BP’s Debt to Debt plus Equity ratio on a gross basis as net debt is not a recognised GAAP measure:
$ million 2004 2005 1Q 2Q 3Q 4Q 1Q 2Q 3Q 4Q Finance debt 19,937 19,858 20,445 23,091 19,564 19,302 22,159 19,162 Equity 72,493 73,088 75,114 78,235 79,911 80,097 82,726 80,765 Debt ratio 22% 21% 21% 23% 20% 19% 21% 19%
Associated Companies – This term includes associates and jointly controlled entities, both of which are accounted for using the equity method of accounting. Growth rates – These are calculated as cumulative average growth rates over a period. They are not therefore growth rates that might be observed year after year. Free cash flow – Net cash provided by operating activities less net cash used in investing activities.
7th February 2006 4
SLIDE 5 Supplementary information BP 4Q05 results and strategy presentation
The following table details the calculation of free cash flow:
$ million 2003 2004 2005 Net cash provided by operating activities 16,303 23,378 26,721 Net cash used in operating activities (9,281) (11,331) (1,729) Free cash flow 7,022 12,047 24,992
Rules of Thumb: Important note: The rules of thumb shown below are intended to give directional indicators of the impact of changes in the trading environment relative to that of 2005 on BP’s 2006 full year pre-tax results. These rules of thumb are approximate. As prices and margins may deviate sharply and volatility has increased, these rules of thumb have become less accurate in quantifying the impact of changes. Especially over short periods, changes in differentials, seasonal demand patterns, and other factors can be material. Particular differences may arise due to changes in government shares of Exploration and Production revenues in some jurisdictions at different price levels, as well as changes in North American gas basin differentials versus Henry Hub reflecting differences in local supply, demand and pipeline capacities. Particular differences may also arise from variations between the refining Global Indicator Margin (GIM) and BP’s realized refining margins due to crude price levels and differentials, product price movements and other factors. Rules of thumb assume normal
- r expected production and throughputs. Instances such as the shut down of the Texas
City refinery will in the short term impact the scale and accuracy of these rules. Many other factors will affect BP’s earnings quarter by quarter. Actual results in individual quarters may therefore differ significantly from the estimates implied by the application of these rules of thumb. 2006 Operating Environment Rules of Thumb: impact on replacement cost profit before interest and tax per year of changes relative to 2005 environment
Oil Price – Brent +/- $1/bbl Full Year $500m Gas – Henry Hub +/- $ 0.10/mcf $80m Refining – GIM +/- $ 1/bbl $950m Exploration and Production:
Reserve replacement ratio – The ratio of reserves booked through discoveries, extensions, net revisions and improved recovery to production for the period. This measure excludes the effects of acquisitions and disposals. Unless stated otherwise, this ratio is based on a combined basis which includes both subsidiaries and equity accounted entities and it based on SORP reserves.
7th February 2006 5
SLIDE 6 Supplementary information BP 4Q05 results and strategy presentation
SORP reserves are based on our long term planning price of $25/bbl. Where we refer to SEC reserves basis reserve replacement ratio (RRR), this is calculated using the above changes to reserve volumes but where reserves are based
- n the price at 31 December 2005 (Brent $58.21/bbl).
The SEC basis for calculating RRR is based on reserves booked through discoveries, extensions, net revisions and improved recovery to production for the period including the effects of acquisitions and disposals. This measure is estimated using the year end price. EBITDA – This measure is replacement cost profit before interest and tax adjusted to add back non-operating items, depreciation, depletion and amortization and equity- accounted interest and tax. The following table reconciles EBITDA to Exploration & Production profit before interest and tax:
$ million 2005 Profit before interest and tax 25,508 Inventory holding gains (17) Replacement cost profit before interest and tax 25,491 Non-operating items 998 Depreciation, depletion and amortization 6,029 Equity-accounted interest and tax 1,476 EBITDA 33,994 Adjustment for oil and natural gas environment (9,687) EBITDA, adjusted for environment 24,307
- Adjustment for oil and natural gas environment: For the purposes of yearly
comparisons, BP adjusts E&P turnover to standard oil and natural gas marker ($40/bbl Brent and $6.00/mmcf HH) and differential price assumptions and also adjusts for the costs of fuel. This normalization is done at the business unit level. The adjustment will differ form an estimate done using 2005 Rules of Thumb, as actual price and margin impacts can vary due to number of factors, including actual volumes and portfolio mix, location and quality differentials and production tax impacts across changing price levels. Production – Crude oil, natural gas liquids (NGL) and natural gas produced from consolidated operations, and BP’s interest in joint ventures and associates. Converted to barrels of oil equivalent (boe) at 1 barrel of NGL = 1 boe and 5,800 standard cubic feet of natural gas = 1 boe. Historical volumes shown are as previously reported. Projections reflect indications, not targets, and are based on assumed prices equivalent to $40 per barrel Brent and $6.00 per million British thermal units Henry Hub natural gas, as well as averages for operating uptime, liftings proportionate to BP’s interest, and historic OPEC quota allocations. This is not an amount that can be targeted, nor is it a specific forecast for a year. The indicator does not include any provision for downtime above the average observed over the last five years, the effect of prices compared to $40 Brent on entitlement volumes
7th February 2006 6
SLIDE 7 Supplementary information BP 4Q05 results and strategy presentation
from Production Sharing Contracts, the effect of weather patterns outside of the normal trend, as well as all items noted in the forward-looking statements cautionary statement. Existing profit centre – Used to describe the grouping of our operations in Alaska, Egypt, Latin America (including Argentina, Brazil, Colombia, Mexico and Venezuela), Middle East (including Abu Dhabi, Sharjah and Pakistan), North America Gas (Onshore US, the Gulf of Mexico Shelf and Canada), North Sea (UK, Netherlands and Norway). New profit centre – Used to describe the grouping of our operations in Asia Pacific (Australia, Vietnam, Indonesia, China), Azerbaijan, Angola, Algeria, Trinidad and Deepwater Gulf of Mexico. Proved oil and gas reserves – Proved oil and gas reserves are the estimated quantities
- f crude oil, natural gas, and natural gas liquids which geological and engineering data
demonstrate with reasonable certainty to be recoverable in future years from known reservoirs under our existing economic and operating conditions. Proved developed reserves – Proved reserves that can be expected to be recovered through existing wells with existing equipment and operating methods. Additional oil and natural gas expected to be obtained through the application of fluid injection or other improved recovery techniques for supplementing the natural forces and mechanisms of primary recovery are included as ‘proved developed reserves’ only after testing by a pilot project or after the operation of an installed programme has confirmed through production response that increased recovery will be achieved. Proved undeveloped reserves – Proved reserves that are expected to be recovered from new wells on undrilled acreage, or from existing wells where a relatively major expenditure is required for recompletion. Reserves on undrilled acreage are limited to those drilling units offsetting productive units that are reasonably certain of production when drilled. Proved reserves for other undrilled units are claimed only where it can be demonstrated with certainty that there is continuity of production from the existing productive formation. Under no circumstances are estimates of proved undeveloped reserves attributable to acreage for which an application of fluid injection or other improved recovery technique is contemplated, unless such techniques have been proved effective by actual tests in the area and in the same reservoir. Non-proved reserves are not recognised for SEC purposes. Unit cash margin – This measure is EBITDA (as defined above) divided by reported production.
7th February 2006 7
SLIDE 8 Supplementary information BP 4Q05 results and strategy presentation
Refining and Marketing:
Global Indicator Margin (GIM) – The Global Indicator Refining Margin is the average of six regional indicator margins weighted for BP’s crude refining c apacity in each region. Each regional indicator margin is based on a single representative crude with product yields characteristic of the typical level of upgrading complexity. The regional indicator margins may not be representative of the margins achieved by BP in any period because of BP’s particular refinery configurations and crude and product slate. Energy intensity index (EII) – EII is a standard industry measure developed by Solomon
- Associates. It is the ratio of the Actual Refinery Energy Consumption to the theoretical
standard energy consumption required for the same overall operation. A standard energy consumption is calculated for each individual process unit based on the actual throughput, with adjustments for technology type, feed properties, key
- perational factors and severity of operation on some units (for example, reformate
Octane number on cat reformers, crude API on Crude units, coke make on FCCUs). Summation of all of the individual standard energies gives the total theoretical energy consumption required for the refinery to process the same feedstocks to the same
EII = Total Actual Energy Consumption / Total Standard Energy Consumption * 100% The standard energy factors used for each process unit are based on the average technology in place in the US industry at the beginning of the 1980's. Thus the average industry EII in 1981 in the USA was 100. The original technical baseline standards for each unit have been retained such that the industry now records lower average numerical values, with the reductions reflecting subsequent improvements in technology, investments and improved operating efficiencies. Commercial Optimisation Index – Commercial optimisation is an internal operating metric that measures incremental benefit, on a unit basis, from optimizing feedstock and product (price, quality, timing, freight) as well as other trading income against a set benchmark for each site. Cost Efficiency Index – This measure is used internally at BP to benchmark operating
- efficiency. It measures certain process and activity costs on a unit production basis, at a
constant energy basis. Gross Margin – Store sales: Sales less purchases. Gross Margin – Ultimate: Sales less purchases less certain distribution costs. Unit gross margin – This measure is the ratio of gross margin to volume, except in the case of store unit margin, which is the ratio of gross margin to turnover.
7th February 2006 8