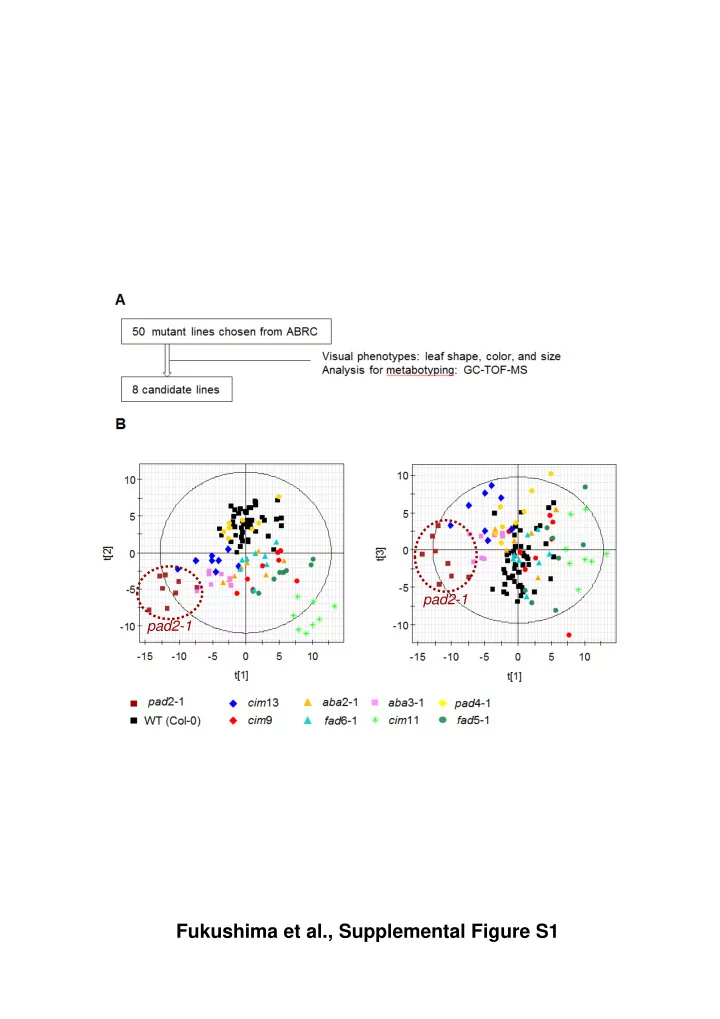

pad2-1 pad2-1 Fukushima et al., Supplemental Figure S1
A Col - 0 +MV0.01 µ M +MV0.05 µ M +MV0.1 µ M MS B +MV0.01 µ M MS pad2-1 Col - 0 +MV0.05 µ M +MV0.03 µ M Fukushima et al., Supplemental Figure S2
1) Control (no-stress) Col-0 pad2-1 cad2-1 2) MS with MV 3) P-lim Fukushima et al., Supplemental Figure S3
A WT 7-5 13-6 No-stress MV P-lim B Shoot biomass 70.0 mg FW per plant 60.0 50.0 a a a 40.0 * * a 30.0 20.0 10.0 C 0.0 GSH content b 200 * nmol/g FW b * b b 150 a ** * 100 50 D 0 GSSG content 14 12 nmol/g FW 10 8 b 6 b 4 2 b E 0 GSH:GSSG ratio 300 b b 250 b 200 150 100 50 * 0 WT 7-5 13-6 WT 7-5 13-6 WT 7-5 13-6 P-lim No-stress MV Fukushima et al., Supplemental Figure S4
A Control WT Control pad2-1 60 Control cad2-1 MV WT MV pad2-1 40 MV cad2-1 P-lim WT P-lim pad2-1 PC3 (6%) 20 P-lim cad2-1 t[3] 0 -20 -40 -60 -100 -50 0 50 100 PC1 (17%) t[1] B 60 40 20 PC3 (6%) t[3] 0 -20 -40 -60 -100 -80 -60 -40 -20 0 20 40 60 80 100 t[2] PC2 (10%) Fukushima et al., Supplemental Figure S5
pad2 vs WT A (FDR < 0.05, |log 2 fold-change| >= 1) Increased metabolite set Decreased metabolite set B cad2 vs WT (FDR < 0.05, |log 2 fold-change| >= 1) Increased metabolite set Decreased metabolite set Fukushima et al., Supplemental Figure S6
Treatment comparison A Threonate Sucrose Garactinol Raffinose 8-MTO 8-MSOO Ascorbate Mannose 7-MTH 7-MSOH Dehydroascorbate Glucose Gluconate Galacturonate TAG 54:9 TAG 54:8 TAG 54:7 TAG 52:5 Fructose Xylose 6-MTH 6-MSOH G6P Maltose PC 34:6 PC 36:2 PC 36:1 Arabinose 5-MSOP F6P 5-MTP GSH Trehalose PG 34:3 PG 34:2 Glycerol-3P Glycine 4-MTB 4-MSOB Glycerol F6PP PE 36:2 Inositol Inositol-1P Glycerate Serine 3-MTP 3-MSOP Cysteine Methionine 3PGA PI 34:3 PI 34:2 Shikimate Tryptophan 4H-I3M Leucine PEP Valine Threonine α -Tocopherol Tyrosine 1H-I3M Pyruvate DGDG DGDG Isoleucine 36:3 34:2 Cou-agmatine Alanine Campesterol Phenylalanine Lysine Acetyl-CoA β -Sitosterol Caffeate HomoSerine Sinapate Citrate Octadecatrienoate Oxaloacetate β −Alanine Aspartate cis -Aconitate Dolichol dehydro- Malate decaprenol WT cad2-1 pad2-1 Dihydrouracil Asparagine Kaem F1 Quer F5 Antho A5 Dolichol Fumarate Isocitrate * * * MV/no-stress undecaprenol P-lim/no-stress Kaem F2 Quer F6 Antho A8 Succinate 2-Oxoglutarate Glutamine * * * * Urea -2 -1 1 2 Kaem F3 Antho A10 Glutamate Arginine Ornithine Succinyl-CoA 4-Amino- Log 2 fold-change Putrescine Spermidine butyrate Proline Kaem F4 Antho A11 * * * * * * B Genotype comparison Threonate Sucrose Garactinol Raffinose 8-MTO 8-MSOO Ascorbate Mannose 7-MTH 7-MSOH Dehydroascorbate Glucose Gluconate Galacturonate TAG 54:9 TAG 54:8 TAG 54:7 TAG 52:5 Fructose Xylose 6-MTH 6-MSOH G6P Maltose PC 34:6 PC 36:2 PC 36:1 Arabinose 5-MSOP F6P 5-MTP GSH Trehalose PG 34:3 PG 34:2 Glycerol-3P Glycine 4-MTB 4-MSOB Glycerol F6PP PE 36:2 Inositol Inositol-1P Glycerate Serine 3-MSOP 3-MTP Cysteine Methionine 3PGA PI 34:3 PI 34:2 Shikimate Tryptophan Leucine 4H-I3M PEP Valine Threonine α -Tocopherol Tyrosine 1H-I3M Pyruvate DGDG DGDG Isoleucine 36:3 34:2 Cou-agmatine Alanine Campesterol Phenylalanine Lysine Acetyl-CoA β -Sitosterol Caffeate HomoSerine Sinapate Citrate Octadecatrienoate Oxaloacetate β −Alanine Aspartate cis -Aconitate Dolichol dehydro- Malate decaprenol No-stress P-lim MV Dihydrouracil Asparagine Kaem F1 Quer F5 Antho A5 Dolichol pad2-1 /WT Fumarate Isocitrate undecaprenol cad2-1 /WT Kaem F2 Quer F6 Antho A8 Succinate Glutamine 2-Oxoglutarate Urea -2 -1 1 2 Kaem F3 Antho A10 Glutamate Arginine Ornithine Succinyl-CoA 4-Amino- Log 2 fold-change Putrescine Spermidine butyrate Kaem F4 Antho A11 Proline Fukushima et al., Supplemental Figure S7
A. Genotype comparison under MV pad2 -specific term under MV pad2 -specific term under control Link in pad2 vs WT under MV Link in pad2 vs WT under control Iron ion homeostatis ROS Metal ion B. Genotype comparison under P-lim Response metal Response salt pad2 -specific term under P-lim stress ion inorganic pad2 -specific term under control Link in pad2 vs WT under P-lim ROS Link in pad2 vs WT under control Hormone stimulus response salicylic Iron ion homeostasis Organism biotic (FDR < 1E-04, Enrichment Map) Fukushima et al., Supplemental Figure S8
A Hormone metabolism Treatment comparison MV vs. Control P-lim vs. Control pad2 FDR = 1.0E-2 FDR = 1.3E-3 WT FDR = 8.0E-7 FDR = 1.5E-8 B Genotype comparison ( pad2 vs. WT) Control FDR = 2.6E-3 MV FDR = 8.2E-2 FDR = 1.5E-2 FDR = 7.8E-2 P-lim FDR = 3.0E-2 Fukushima et al., Supplemental Figure S9
A Secondary metabolism Treatment comparison MV vs. Control P-lim vs. Control pad2 pad2 WT WT (3.2E-3) (1.9E-5) (1.2E-3) (5.7E-3) (3.6E-12) (1.1E-2) Glucosinolate metabolism (1.7E-10) B Genotype comparison ( pad2 vs. WT) Control MV P-lim Isoprenoids (5.0E-3) (3.0E-3) (1.5E-6) (5.0E-3) Fukushima et al., Supplemental Figure S10
A Cell wall metabolism Treatment comparison MV vs. Control P-lim vs. Control pad2 CS (3.1E-2) HRGP (9.1E-2) (2.2E-3) Precursor synth. WT LRR (7.6E-2) CS (3.1E-2) B Pectin*esterases (2.2E-4) Genotype comparison Modification (8.1E-4) ( pad2 vs. WT) Control 10.6.2 (2.6E-2) MV P-lim AGPs (3.7E-2) Fukushima et al., Supplemental Figure S11
A Treatment comparison Down-regulated genes under MV Down-regulated genes under P-lim WT pad2-1 pad2-1 WT Included: Included: Included: Included: Included: Included: ERF-1 WRKY40 WRKY33 ERF105 ERF6 GSTU9 ERF6 WRKY70 UGT74E2 DJC23 ERF104 UGT74E2 ERF104 MYB77 GSTU9 MYBL2 PYE CYP81D8 ERF105 MYBL2 GSTU24 ATCTH WRKY70 HSFA2 bZIP1 RD29A UGT73C1 BHLH039 DJC77 BZIP9 SAUR78 UGT73C6 BHLH101 HSP70 LBD37 CYP81D8 BHLH136 HSP101 LBD39 HSFA2 HSP23.6-MITO HSP70 HSP17.4 HSP101 HSP17.6II HSP23.6-MITO HSP17.6 HSP17.6 Hsp90-1 Hsp90-1 B Genotype comparison Down-regulation in pad2-1 under no-stress MV-treatment Included: Included: HMT3 GSTF3 CSLA10 CNGC11 PYD4 ARK3 CRK5 RLK1 Included: Included: FAMT JAZ7 P-lim TAT (log 2 fold-change <= 1 and FDR < 0.05, LIMMA) Fukushima et al., Supplemental Figure S12
Recommend
More recommend