SLIDE 1 1
Summary of Demographic and Utilization Study
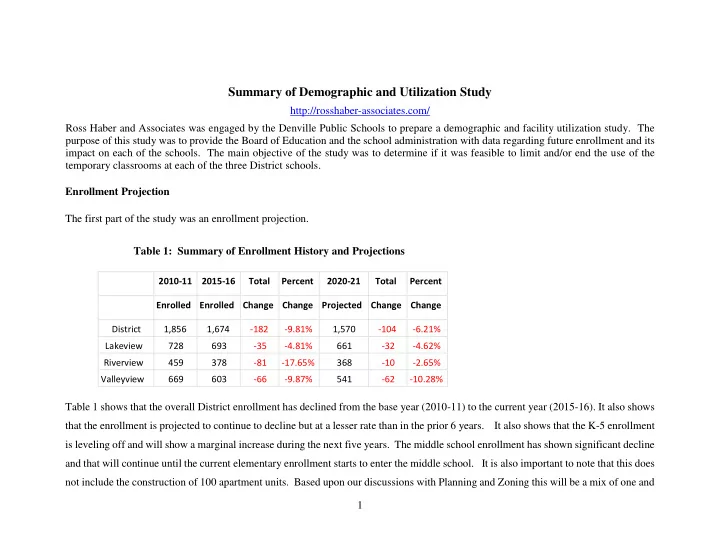
http://rosshaber-associates.com/ Ross Haber and Associates was engaged by the Denville Public Schools to prepare a demographic and facility utilization study. The purpose of this study was to provide the Board of Education and the school administration with data regarding future enrollment and its impact on each of the schools. The main objective of the study was to determine if it was feasible to limit and/or end the use of the temporary classrooms at each of the three District schools. Enrollment Projection The first part of the study was an enrollment projection. Table 1: Summary of Enrollment History and Projections
2010-11 2015-16 Total Percent 2020-21 Total Percent Enrolled Enrolled Change Change Projected Change Change District 1,856 1,674
1,570
Lakeview 728 693
661
Riverview 459 378
368
Valleyview 669 603
541
Table 1 shows that the overall District enrollment has declined from the base year (2010-11) to the current year (2015-16). It also shows that the enrollment is projected to continue to decline but at a lesser rate than in the prior 6 years. It also shows that the K-5 enrollment is leveling off and will show a marginal increase during the next five years. The middle school enrollment has shown significant decline and that will continue until the current elementary enrollment starts to enter the middle school. It is also important to note that this does not include the construction of 100 apartment units. Based upon our discussions with Planning and Zoning this will be a mix of one and
SLIDE 2 2 two bedroom rental units. Based upon the yield ratios used by the Rutgers Study1 these 100 units will yield approximately 26 K-12 students of which 19 are projected to be K-8 students. These will be in the Lakeview attendance area. While these numbers (approximately 2.1 students per grade) will not impact the number of sections they will have some impact on class size. Facility Utilization The objective of the facility utilization component of the study was to determine if , based upon the enrollment projections, there was enough classroom space in each building to maintain programs and current class sizes if the temporary classroom units were eliminated. The study consisted of surveys and interviews with the principals of each building, analysis of the building floor plans, and on-site
- reviews. It is important to note that although the enrollment in the Denville Public Schools has declined the need for space, during that
period of decline, has increased. The implementation of full day kindergarten increased the need for full sized rooms in the elementary
- schools. In addition, expansion of special services programs and related services has further taken up classroom space in each building.
These are the reasons why even with declining enrollment space is at a premium. At Riverview the two temporary classrooms are currently used by guidance and by the Child Study Team. There are some students who do spend some time in the Child Study Team area of the temporary units. At Lakeview the music programs occupy the two portable classrooms and at Valleyview there is some instruction in the temporary units. Based upon meetings with Central Administration and the building administrators it was determined that the music programs at Lakeview can be moved inside the main building thus making it possible to move special services into these units with some renovation. At Riverview there would no longer be need for the temporary units and they would be removed. The units at Valleyview can be closed and all programs which currently are in the temporary classrooms can be accommodated in the building.
1 Who Lives in New Jersey Housing, Rutgers University Center for Urban Studies http://www.state.nj.us/state/planning/docs/wholivesquickguide.pdf
SLIDE 3 3 It is the opinion of Ross Haber and Associates that the solutions found in this study are good in the sense that many of the temporary units can be removed and that there will no longer be any students in these structures. However, this solution may not be sustainable
- ver the long term. We strongly recommend that the District consider the feasibility of adding classroom space to Riverview (it appears
that it might be possible to add a second floor to Riverview for additional classroom space. The District might consider studying the financial impact expanding classroom space at Riverview. Explanation of following tables: Table 2: Shows the District-wide enrollment history and projections through the 2020-21 school year. Kindergarten projections were based upon a moving average of students as opposed to birth to kindergarten. The standard method of using livebirths produced inconsistent results. Table 3: This is the Lakeview History and Project Table. Table 4: Lakeview Utilization Table-this shows the total number of sections needed (general education and special education) and the average class size per grade and for the entire building. The average class sizes per year range between 21 and 22. This table also shows that Lakeview is fully utilized and will remain so through the projection period. Table 5: This shows the distribution of full sized classrooms across all programs. There are 41 full sized rooms plus the two Learning Cottages which are currently being used for music. At this point there does not appear to be any room availability within the building for the music program. Table 6: This is the Riverview History and Projection Table. Table 7: Riverview Utilization Table-this shows the total number of sections needed (general education and special education) and the average class size per grade and for the entire building. The average class sizes per year range between 19 and 22. This table also shows that Riverview might have one open classroom beginning with the 2017-18 school year. Table 8: This is the Riverview classroom distribution table. It shows the total utilization of large classrooms across all programs.
SLIDE 4
4 The Learning Cottages are used for guidance and the Child Study Team. At this time there is no room or space in the building for these two services. One room might be available in 2017-18. Table 9: This is the middle school enrollment history and projection. With the significant and continuing decline in enrollment it might be possible to move some District-wide programs from the elementary schools to the middle school. This might include the Child Study Team rooms and selected self-contained special education programs (which would need to be fully explored with the Director of Special Services.
SLIDE 5
5 Chart 1: District-Wide Enrollment History and Projection
1856 1823 1747 1720 1663 1674 1648 1607 1596 1596 1570 1400 1450 1500 1550 1600 1650 1700 1750 1800 1850 1900 2010-11 2011-12 2012-13 2013-14 2014-15 2015-16 2016-17 2017-18 2018-19 2019-20 2020-21
SLIDE 6
6 Table 2: District-Wide Enrollment History and Projection Highlighted cells represent a bubble group passing through the system.
Year Births K 1 2 3 4 5 6 7 8 K-5 6-8 Sub PK SCSE Total Total PK-8 2010-11 200 0.68 135 166 185 213 209 227 233 224 212 1135 669 1804 14 38 1856 1.19 1.07 1.02 1.01 1.02 1.03 0.97 0.98 2011-12 188 0.71 134 161 178 189 216 214 233 227 220 1092 680 1772 24 27 1823 1.28 0.99 1.03 1.02 1.02 0.96 0.96 1.01 2012-13 164 0.73 120 171 159 183 193 221 206 223 230 1047 659 1706 23 18 1747 1.25 1.05 1.03 1.01 0.98 0.99 1.01 0.98 2013-14 194 0.75 145 150 180 164 184 189 219 208 219 1012 646 1658 29 33 1720 1.06 1.03 1.05 1.02 1.01 1.01 1.01 0.96 2014-15 163 0.91 148 153 155 189 167 186 190 221 199 998 610 1608 26 29 1663 1.12 1.10 1.06 1.05 1.04 1.01 1.15 0.90 2015-16 163 0.84 137 166 169 165 199 173 187 218 198 1009 603 1612 32 30 1674 0.79 1.09 1.05 1.04 1.02 1.01 1.00 1.02 0.97 Year K 1 2 3 4 5 6 7 8 K-5 6-8 Sub PK SCSE Total ` Total PK-8 2016-17 153 143 149 174 176 168 201 173 191 211 1011 575 1586 32 30 1648 2017-18 153 140 156 156 181 180 170 201 176 185 983 562 1545 32 30 1607 2018-19 153 142 153 164 162 185 182 170 205 171 988 546 1534 32 30 1596 2019-20 153 141 155 161 171 165 187 182 173 199 980 554 1534 32 30 1596 2020-21 153 142 154 163 167 174 167 187 186 168 967 541 1508 32 30 1570
SLIDE 7
7 Table 3: Lake View Elementary School Enrollment History and Projection
Lakeview KG 1 2 3 4 5 K-5 Sp Ed PK Total Births 2010-11 200 83 103 104 149 122 129 690 24 14 728 2011-12 188 79 102 106 107 151 125 670 18 24 712 2012-13 164 82 100 102 108 116 154 662 11.00 23 696 2013-14 194 91 106 105 104 108 108 622 20.00 29 671 2014-15 163 95 95 110 109 106 112 627 18.00 26 671 2015-16 163 88 107 106 117 115 107 640 21.00 32 693 Year KG 1 2 3 4 5 K-5 Sp Ed PK Total 2016-17 153 92 96 111 108 118 117 642 21 32 695 2017-18 153 90 100 100 113 109 120 632 21 32 685 2018-19 153 91 98 104 102 114 111 620 21 32 673 2019-20 153 91 99 102 106 103 116 617 21 32 670 2020-21 153 90 99 103 104 107 105 608 21 32 661
SLIDE 8
8 Chart 2: Lake View Elementary School Enrollment History and Projection
728 712 696 671 671 693 695 685 673 670 661 620 640 660 680 700 720 740
SLIDE 9
9 Table 4: Lakeview Utilization
SLIDE 10
10
2015-16 Rooms Actual Average 2016-17 Rooms Actual Average 2017-18 Rooms Actual Average 25.00 Class Size 25.00 Class Size 25.00 Class Size 25.00 25.00 25.00 KG 88 3.52 4 22 KG 92 3.68 4 23 KG 90 3.60 4 23 1 107 4.28 5 21 1 96 3.84 5 19 1 100 4.00 5 20 2 106 4.24 5 21 2 111 4.44 5 22 2 100 4.00 5 20 3 117 4.68 5 23 3 108 4.32 5 22 3 113 4.52 5 23 4 115 4.60 5 23 4 118 4.72 5 24 4 109 4.36 5 22 5 107 4.28 5 21 5 117 4.68 5 23 5 120 4.80 5 24 Spec Ed 21 6 Spec Ed 21 6 Spec Ed 21 6 PK 32 3.00 3 PK 32 3.00 3 PK 32 3.00 3 22 22 693 17.80 38 22 695 17.32 25 685 16.88 25 Total Rms 41 Total Rms 41 Total Rms 41 Rooms GE 29 Rooms GE 29 Rooms GE 29 Rooms SE 6 Rooms SE 6 Rooms SE 6 Rooms PK 3 Rooms PK 3 Rooms PK 3 Other Used 3 Other Used 3 Other Used 3 Open Open Open 2018-19 Rooms Actual Average 2019-20 Rooms Actual Average 2020-21 Rooms Actual Average 25.00 Class Size 25.00 Class Size 25.00 Class Size 25.00 25.00 25.00 KG 91 3.64 4 23 KG 91 3.64 4 23 KG 90 3.60 4 23 1 98 3.92 5 20 1 99 3.96 5 20 1 99 3.96 5 20 2 104 4.16 5 21 2 102 4.08 5 20 2 103 4.12 5 21 3 102 4.08 5 20 3 106 4.24 5 21 3 104 4.16 5 21 4 114 4.56 5 23 4 103 4.12 5 21 4 107 4.28 5 21 5 111 4.44 5 22 5 116 4.64 5 23 5 105 4.20 5 21 Spec Ed 21 6 Spec Ed 21 6 Spec Ed 21 6 PK 32 3.00 3 PK 32 3.00 3 PK 32 3.00 3 673 16.72 38 22 670 16.40 25 21 661 16.52 25 21 Total Rms 41 Total Rms 41 Total Rms 41 Rooms GE 29 Rooms GE 29 Rooms GE 29 Rooms SE 6 Rooms SE 6 Rooms SE 6 Rooms PK 3 Rooms PK 3 Rooms PK 3 Other Used 3 Other Used 3 Other Used 3 Open Open Open Lakeview
SLIDE 11
11 Table 5: Lakeview Room Distribution
SLIDE 12 12
Grade Room Size Resource B16 F Resource B14 F KG AO1 F Pre-K A03 F KG A03 F Pre-K AO4 F KG C05 F Pre-K AO7 F KG C06 F K - SC A02 F 1 A08 F SC 1-2 A05 F 1 A09 F SC 3-4-5 C 18/19 F/S (split room) 1 A010 F Science C21 F 1 A011 F Computer C03 F 1 A012 F Art B11 F 2 B01 F Grades 3-4/BSI/Erly Connection B07 F 2 B02 F 2 BO3 F Total 12 2 B15 F 2 B17 F 3 B04 F 3 B05 F 3 BO6 F 3 B08 F 3 B12 F 4 C07 F 4 C08 F 4 C09 F 4 C16 F 4 C17 F 5 C10 F 5 C11 F 5 C13 F 5 C14 F 5 C15 F Total Gen Ed 29 General Education Rooms Lakeview Other Full Sized Rooms Total of 41 full sized rooms excluding the Learning Cottage which is currently used for music. Child study team in main
- ffice, and/or art on a cart.
Music out of cottages and into room B 11 or other alternater room.
SLIDE 13
13 Table 6: Riverview Enrollment History and Projection
Riverview KG 1 2 3 4 5 K-5 Sp Ed PK Total Births 2010-11 200 52 63 81 64 87 98 445 14 459 2011-12 188 55 59 72 82 65 89 422 9 431 2012-13 164 38 71 57 75 77 67 385 7 392 2013-14 194 54 44 75 60 76 81 390 13 403 2014-15 163 53 58 45 80 61 74 371 11 382 2015-16 163 49 59 63 48 84 66 369 9 378 Year KG 1 2 3 4 5 K-5 Sp Ed PK Total 2016-17 153 51 53 63 68 50 84 369 9 378 2017-18 153 50 56 56 68 71 50 351 9 360 2018-19 153 51 55 60 60 71 71 368 9 377 2019-20 153 50 56 59 65 62 71 363 9 372 2020-21 153 52 55 60 63 67 62 359 9 368
SLIDE 14
14 Chart 3: Riverview Enrollment History and Projection
459 431 392 403 382 378 378 360 377 372 368 350 360 370 380 390 400 410 420 430 440 450 460 470
SLIDE 15
15 Table 7: Riverview Utilization
2015-16 Rooms Actual Average 2016-17 Rooms Actual Average 2017-18 Rooms Actual Average 25.00 Class Size 25.00 Class Size 25.00 Class Size 25.00 25.00 25.00 KG 49 1.96 3 16 KG 51 2.04 3 17 KG 50 2.00 3 17 1 59 2.36 3 20 1 53 2.12 3 18 1 56 2.24 3 19 2 63 2.52 3 21 2 63 2.52 3 21 2 56 2.24 3 19 3 48 1.92 3 16 3 68 2.72 3 23 3 68 2.72 3 23 4 84 3.36 4 21 4 50 2.00 3 17 4 71 2.84 3 24 5 66 2.64 3 22 5 84 3.36 4 21 5 50 2.00 3 17 Spec Ed 9 3 Spec Ed 9 3 Spec Ed 9 3 20 20 378 10.16 22 19 378 9.36 22 360 10.04 21 Total Rms 28 Total Rms 28 Total Rms 28 Rooms GE 19 Rooms GE 19 Rooms GE 18 Rooms SE 3 Rooms SE 3 Rooms SE 3 Other Used 6 Other Used 6 Other Used 6 Open Open Open 1 2018-19 Rooms Actual Average 2019-20 Rooms Actual Average 2020-21 Rooms Actual Average 25.00 Class Size 25.00 Class Size 25.00 Class Size 25.00 25.00 25.00 KG 51 2.04 3 17 KG 50 2.00 3 17 KG 52 2.08 3 17 1 55 2.20 3 18 1 56 2.24 3 19 1 55 2.20 3 18 2 60 2.40 3 20 2 59 2.36 3 20 2 60 2.40 3 20 3 60 2.40 3 20 3 65 2.60 3 22 3 63 2.52 3 21 4 71 2.84 3 24 4 62 2.48 3 21 4 67 2.68 3 22 5 71 2.84 3 24 5 71 2.84 3 24 5 62 2.48 3 21 Spec Ed 9 3 Spec Ed 9 3 Spec Ed 9 3 377 9.84 21 21 372 9.68 21 21 368 9.80 21 20 Total Rms 28 Total Rms 28 Total Rms 28 Rooms GE 18 Rooms GE 18 Rooms GE 18 Rooms SE 3 Rooms SE 3 Rooms SE 3 Other Used 6 Other Used 6 Other Used 6 Open 1 Open 1 Open 1 Riverview
SLIDE 16
16
SLIDE 17
17 Table 8: Riverview Classroom Distribution Grade Room Size Computer 1 Large Resource 3 Large KG F Art 1 Large KG F Science Resource 1 Large KG F Speech 1 Large 1 F Self Contained 2 1 F 1 F 2 F 2 F 2 F 3 F 3 F 3 F Total 9 4 F 4 F 4 F 4 F 5 F 5 F 5 F Total Gen Ed 19 General Education Rooms Other Full Sized Rooms Guidance in Learning Cottage CST in Learning Cottage Music on stage in All Purpose room.
SLIDE 18
18 Table 9: Middle School Enrollment History and Projection
Year 6 7 8 Total 2010-11 233 224 212 669 2011-12 233 227 220 680 2012-13 206 223 230 659 2013-14 219 208 219 646 2014-15 190 221 199 610 2015-16 187 218 198 603 6 7 8 2016-17 173 191 211 575 2017-18 201 176 185 562 2018-19 170 205 171 546 2019-20 182 173 199 554 2020-21 187 186 168 541
SLIDE 19
19 Chart 4: Middle School Enrollment History and Projection
669 680 659 646 610 603 575 562 546 554 541 500 520 540 560 580 600 620 640 660 680 700