Overview of this module Course 02429 Design Matrix 1 Analysis of - - PowerPoint PPT Presentation

overview of this module course 02429
SMART_READER_LITE
LIVE PREVIEW

Overview of this module Course 02429 Design Matrix 1 Analysis of - - PowerPoint PPT Presentation

Overview of this module Course 02429 Design Matrix 1 Analysis of correlated data: Mixed Linear Models Fixed model Mixed model Module 4: Theory, Part I Mixed model 2 Definition, Matrix form The likelihood function Per Bruun Brockhoff The


slide-1
SLIDE 1

Course 02429 Analysis of correlated data: Mixed Linear Models Module 4: Theory, Part I Per Bruun Brockhoff

DTU Compute Building 324 - room 220 Technical University of Denmark 2800 Lyngby – Denmark e-mail: perbb@dtu.dk

Per Bruun Brockhoff (perbb@dtu.dk) Mixed Linear Models, Module 4 Fall 2014 1 / 33

Overview of this module

1

Design Matrix Fixed model Mixed model

2

Mixed model Definition, Matrix form The likelihood function The REML method Likelihood Ratio tests Restricted Likelihood Ratio tests

3

Testing of FIXED effects Wald F–test (& Satterthwaite’s) Partial and sequential ANOVA Tables Confidence intervals of fixed effects

4

Test of random effects parameters Confidence intervals for random effects parameters

5

The overall approach

Per Bruun Brockhoff (perbb@dtu.dk) Mixed Linear Models, Module 4 Fall 2014 2 / 33

Aim of this module

Define random effects models in some details See what’s “inside” a mixed model Write down the Likelihood See how model parameters are estimated Tests and confidence intervals How are tests computed (fixed and variance parameters) How are confidence intervals constructed (fixed and variance parameters)

Per Bruun Brockhoff (perbb@dtu.dk) Mixed Linear Models, Module 4 Fall 2014 3 / 33 Design Matrix Fixed model

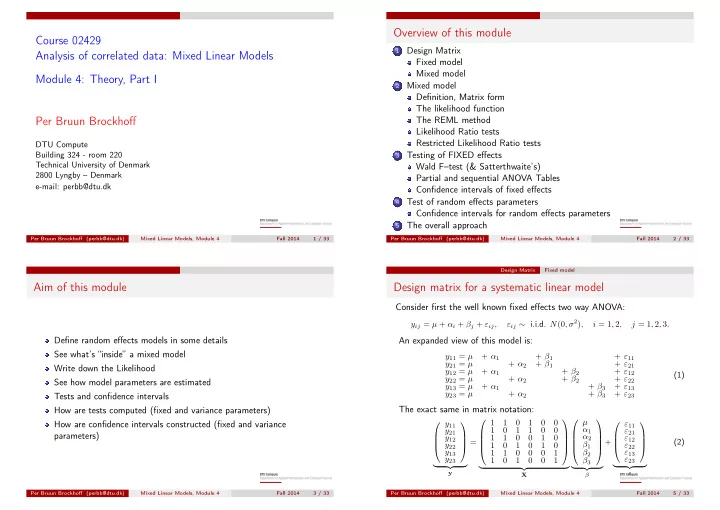
Design matrix for a systematic linear model

Consider first the well known fixed effects two way ANOVA:

yij = µ + αi + βj + εij, εij ∼ i.i.d. N(0, σ2), i = 1, 2, j = 1, 2, 3.

An expanded view of this model is:

y11 = µ + α1 + β1 + ε11 y21 = µ + α2 + β1 + ε21 y12 = µ + α1 + β2 + ε12 y22 = µ + α2 + β2 + ε22 y13 = µ + α1 + β3 + ε13 y23 = µ + α2 + β3 + ε23 (1)

The exact same in matrix notation:

    y11 y21 y12 y22 y13 y23    

  • y

=      1 1 1 1 1 1 1 1 1 1 1 1 1 1 1 1 1 1     

  • X

     µ α1 α2 β1 β2 β3     

  • β

+     ε11 ε21 ε12 ε22 ε13 ε23    

  • ε

(2)

Per Bruun Brockhoff (perbb@dtu.dk) Mixed Linear Models, Module 4 Fall 2014 5 / 33

slide-2
SLIDE 2

Design Matrix Fixed model

    y11 y21 y12 y22 y13 y23    

  • y

=      1 1 1 1 1 1 1 1 1 1 1 1 1 1 1 1 1 1     

  • X

     µ α1 α2 β1 β2 β3     

  • β

+     ε11 ε21 ε12 ε22 ε13 ε23    

  • ε

y is the vector of all observations X is the known as the design matrix β is the vector of fixed effect parameters ε is a vector of independent N(0, σ2) “measurement errors”

The vector ε is said to follow a multivariate normal distribution Mean vector 0 Covariance matrix σ2I Written as: ε ∼ N(0, σ2I)

y = Xβ + ε specifies the model, and everything can be calculated from y and X.

Per Bruun Brockhoff (perbb@dtu.dk) Mixed Linear Models, Module 4 Fall 2014 6 / 33 Design Matrix Fixed model

Construction of the design matrix

In a general systematic linear model (with both factors and covariates), it is surprisingly easy to construct the design matrix X. For each factor: Add one column for each level, with ones in the rows where the corresponding observation is from that level, and zeros

  • therwise.

For each covariate: Add one column with the measurements of the covariate. Remove linear dependencies (if necessary) Example: linear regression: yi = α + β · xi + ε In matrix notation:

y =       1 x1 1 x2 1 x3 . . . . . . 1 xn       α β

  • + ε

Per Bruun Brockhoff (perbb@dtu.dk) Mixed Linear Models, Module 4 Fall 2014 7 / 33 Design Matrix Mixed model

The mixed linear model

Consider now the one way ANOVA with random block effect: yij = µ+αi+bj+εij, bj ∼ N(0, σ2

B),

εij ∼ N(0, σ2), i = 1, 2, j = 1, 2, 3 The matrix notation is:     y11 y21 y12 y22 y13 y23    

  • y

=      1 1 1 1 1 1 1 1 1 1 1 1     

  • X

µ α1 α2

  • β

+      1 1 1 1 1 1     

  • Z

b1 b2 b3

  • u

+     ε11 ε21 ε12 ε22 ε13 ε23    

  • ε

Notice how this matrix representation is constructed in exactly the same way as for the fixed effects model — but separately for fixed and random effects.

Per Bruun Brockhoff (perbb@dtu.dk) Mixed Linear Models, Module 4 Fall 2014 8 / 33 Mixed model Definition, Matrix form

A general linear mixed effects model

A general linear mixed model can be presented in matrix notation by: y = Xβ + Zu + ε, where u ∼ N(0, G) and ε ∼ N(0, R). y is the observation vector X is the design matrix for the fixed effects β is the vector containing the fixed effect parameters Z is the design matrix for the random effects u is the vector of random effects

It is assumed that u ∼ N(0, G) cov(ui, uj) = Gi,j (typically G has a very simple structure (for instance diagonal))

ε is the vector of residual errors

It is assumed that ε ∼ N(0, R) cov(εi, εj) = Ri,j (typically R is diagonal, but we shall later see some useful exceptions for repeated measurements)

Per Bruun Brockhoff (perbb@dtu.dk) Mixed Linear Models, Module 4 Fall 2014 10 / 33

slide-3
SLIDE 3

Mixed model Definition, Matrix form

The distribution of y

From the model description: y = Xβ + Zu + ε, where u ∼ N(0, G) and ε ∼ N(0, R). We can compute the mean vector µ = E(y) and covariance matrix V = var(y): µ = E(Xβ + Zu + ε) = Xβ [All other terms have mean zero] V = var(Xβ + Zu + ε) [from model] = var(Xβ) + var(Zu) + var(ε) [all terms are independent] = var(Zu) + var(ε) [variance of fixed effects is zero] = Zvar(u)Z′ + var(ε) [Z is constant] = ZGZ′ + R [from model] So y follows a multivariate normal distribution: y ∼ N(Xβ, ZGZ′ + R)

Per Bruun Brockhoff (perbb@dtu.dk) Mixed Linear Models, Module 4 Fall 2014 11 / 33 Mixed model Definition, Matrix form

One way ANOVA with random block effect

Consider again the model: yij = µ+αi+bj+εij, bj ∼ N(0, σ2

B),

εij ∼ N(0, σ2), i = 1, 2, j = 1, 2, 3 Calculation of µ and V gives:

µ =        µ + α1 µ + α2 µ + α1 µ + α2 µ + α1 µ + α2        & V =        σ2+σ2

B

σ2

B

σ2

B

σ2+σ2

B

σ2+σ2

B

σ2

B

σ2

B

σ2+σ2

B

σ2+σ2

B

σ2

B

σ2

B

σ2+σ2

B

      

Notice that two observations from the same block are correlated.

Per Bruun Brockhoff (perbb@dtu.dk) Mixed Linear Models, Module 4 Fall 2014 12 / 33 Mixed model The likelihood function

The likelihood function

The likelihood L is a function of model parameters and observations For given parameter values L returns a measure of the probability of

  • bserving y

The negative log likelihood ℓ for a mixed linear model is: ℓ(y, β, γ) ∝ 1 2

  • log |V(γ)| + (y − Xβ)′(V(γ))−1(y − Xβ)
  • Here γ is the variance parameters (σ2 and σ2

B in our example)

A natural estimate is to choose the parameters that make our

  • bservations most likely:

(ˆ β, ˆ γ) = argmin

(β,γ)

ℓ(y, β, γ) This is the maximum likelihood (ML) method

Per Bruun Brockhoff (perbb@dtu.dk) Mixed Linear Models, Module 4 Fall 2014 13 / 33 Mixed model The REML method

The restricted/residual maximum likelihood method

The maximum likelihood method tends to give (slightly) too low estimates of the random effects parameters. We say it is biased downwards The simplest example is:

(x1, . . . , xN) ∼ i.i.d. N(µ, σ2) ˆ σ2 = 1

n

(xi − x)2 is the maximum likelihood estimate, but ˆ σ2 =

1 n−1

(xi − x)2 is generally preferred, because it is unbiased

The restricted/residual maximum likelihood (REML) method modifies the maximum likelihood method by minimizing:

ℓre(y, β, γ) ∝ 1 2

  • log |V(γ)| + (y − Xβ)′(V(γ))−1(y − Xβ)+ log |X′(V(γ))−1X|
  • which gives unbiased estimates (at least in balanced cases)

The REML method is generally preferred in mixed models

Per Bruun Brockhoff (perbb@dtu.dk) Mixed Linear Models, Module 4 Fall 2014 14 / 33

slide-4
SLIDE 4

Mixed model Likelihood Ratio tests

Likelihood ratio tests

The likelihood ratio test can be applied to test A → B if B is a sub–model of A A the model including some fixed/variance parameter(s) B the model without that(these) fixed/variance parameter(s) The test is calculated as: GA→B = 2ℓ(B)

re − 2ℓ(A) re

(These are directly found in the SAS and/or R output) Asymptotically GA→B is χ2

f–distributed, k=number of tested

parameters. So the P–value is: P(χ2

f ≥ GA→B)

Per Bruun Brockhoff (perbb@dtu.dk) Mixed Linear Models, Module 4 Fall 2014 15 / 33 Mixed model Restricted Likelihood Ratio tests

Restricted Likelihood ratio tests

The likelihood ratio test can be applied to test A → B if B is a sub–model of A A the model including some variance parameter(s) B the model without that(these) variance parameter(s) The test is calculated as: GA→B = 2ℓ(B)

re − 2ℓ(A) re

(These are directly found in the SAS and/or R output) Asymptotically GA→B is χ2

f–distributed, k=number of tested

parameters. So the P–value is: P(χ2

f ≥ GA→B)

NB: For testing single variance parameters equal to zero: Divide P-value with 2!

Per Bruun Brockhoff (perbb@dtu.dk) Mixed Linear Models, Module 4 Fall 2014 16 / 33 Testing of FIXED effects

Testing of FIXED effects

Estimating the (variance part) of the model by REML. (Default in both SAS and R) Use F-tests based on these REML estimated variances. (Given by SAS and R) In (only fixed) linear models: These F-tests af often equivalent to Maximum-likelihood based tests, with the ONLY difference that the variance is REML estimated.(using "n-k" instead of "n") Full Maximum likelihood methods are ALSO OK.(comparing log-likelihoods for different models) NEVER use REML based testing for fixed effects. (Only for random) For random effects ML is ALSO OK.

Per Bruun Brockhoff (perbb@dtu.dk) Mixed Linear Models, Module 4 Fall 2014 18 / 33 Testing of FIXED effects

Formulating a hypothesis

A linear hypothesis (what we normally want) is formulated as: L′β = c Two examples both for the simple one way ANOVA model with three treatments: yi = µ + α(treatmenti) + εi 1) Same as α1 − α2 = 0

( 0 1 − 1 0 )

  • L′

   µ α1 α2 α3    = 0

2) Same as α1 = α2 = α3, or the usual test for removing treatment from the model

  • 1

− 1 1 − 1

  • L′

   µ α1 α2 α3    = 0

Per Bruun Brockhoff (perbb@dtu.dk) Mixed Linear Models, Module 4 Fall 2014 19 / 33

slide-5
SLIDE 5

Testing of FIXED effects

Testing fixed effects

The estimate of L′β is L′ ˆ β. From first theory module we know ˆ β, so: L′ ˆ β = L′(X′V−1X)−1X′V−1y A few matrix calculations give: L′ ˆ β ∼ N(L′β, L′(X′V−1X)−1L) So if the hypothesis L′β = c is true we have: (L′ ˆ β − c) ∼ N(0, L′(X′V−1X)−1L) The so called Wald test becomes W = (L′ ˆ β − c)′(L′(X′V−1X)−1L)−1(L′ ˆ β − c)′ W is approximately χ2 rank(L)–distributed

Per Bruun Brockhoff (perbb@dtu.dk) Mixed Linear Models, Module 4 Fall 2014 20 / 33 Testing of FIXED effects Wald F–test (& Satterthwaite’s)

Better approximation: Wald F–test (& Satterthwaite’s)

Wald F–test: F = W d f1 Assumed asymptotically F–distributed d f1 is the number of parameters “eliminated” by the hypothesis (rank(L)) d f2 is:

In R (in lme): chosen as the df from the "contained stratum" In lmerTest: The Satterthwaithe’s method or Kenward-Rogers In car and lsmeans: The Kenward-Rogers

The P–value is computed by: PL′β=c = P(Fd

f1,d f2 ≥ F)

Per Bruun Brockhoff (perbb@dtu.dk) Mixed Linear Models, Module 4 Fall 2014 21 / 33 Testing of FIXED effects Partial and sequential ANOVA Tables

ANOVA tables for linear models

An ANOVA table: A list of SS-values for each effect/term in the model An SS-value expresses the (raw) amount of Y-variation explained by the effect. Successively(sequentially) constructed (In SAS: TYPE I, In R: given by "anova”) Partially constructed (In SAS: TYPE III, In R: given by "drop1” OR "Anova(car)") (Also Type II and IV - but MORE subtle - and NOT so important) Generally: They (may) test different hypotheses - defined by the data structure (e.g. cell counts)

Per Bruun Brockhoff (perbb@dtu.dk) Mixed Linear Models, Module 4 Fall 2014 22 / 33 Testing of FIXED effects Partial and sequential ANOVA Tables

ANOVA tables for linear models

Successively(sequentially) constructed (Type I)

Each SS is corrected ONLY for the effects listed PRIOR to the current effect (given some order of the effects) The order comes from the way the model is expressed in the actual R/SAS model expression. These SS-values sums together to the total SS-value of the data. And hence: They give an actual decomposition of the total variability

  • f the data.

The last SS in the table is also the Type III SS for that effect

Partially constructed (Type III)

Each SS is corrected for ALL the effects in the model These do NOT depend on the way the model is expressed These SS-values will NOT generally sum together to the total SS-value

  • f the data.

And hence: They do NOT give an actual decomposition of the total variability of the data.

Per Bruun Brockhoff (perbb@dtu.dk) Mixed Linear Models, Module 4 Fall 2014 23 / 33

slide-6
SLIDE 6

Testing of FIXED effects Partial and sequential ANOVA Tables

ANOVA tables linear models

ONLY if the data is balanced (e.g. all cell counts nij are equal for a 2-way A × B setting):

The Type I and Type III are the SAME for all effects!

Otherwise:

The Type I and Type III are NOT the SAME!

Generally: We prefer Type III Type I is just sometimes a convenient way of looking at certain decompositions (e.g. in purely nested situations) When we look at "model summary" in R: the tests correspond to "Type III" tests (having been corrected for everything else)

Per Bruun Brockhoff (perbb@dtu.dk) Mixed Linear Models, Module 4 Fall 2014 24 / 33 Testing of FIXED effects Confidence intervals of fixed effects

Confidence intervals of fixed effects

For a one dimensional linear combination L′β (For instance α1 − α2) We know the estimate L′ ˆ β We know the standard deviation

  • L′(X′V−1X)−1L

So the 95% confidence interval based on the t–distribution becomes L′ ˆ β ± t0.975,d

f

  • L′(X′V−1X)−1L

Satterthwaite’s or Kenward-Rogers is used to determine d f

Per Bruun Brockhoff (perbb@dtu.dk) Mixed Linear Models, Module 4 Fall 2014 25 / 33 Testing of FIXED effects Confidence intervals of fixed effects

Testing of FIXED effects

Estimating the (variance part) of the model by REML. (Default in both SAS and R) Use F-tests based on these REML estimated variances. (Given by SAS and R) In (only fixed) linear models: These F-tests af often equivalent to Maximum-likelihood based tests, with the ONLY difference that the variance is REML estimated.(using "n-k" instead of "n") Full Maximum likelihood methods are ALSO OK.(comparing log-likelihoods for different models) NEVER use REML based testing for fixed effects. (Only for random) For random effects ML is ALSO OK (but we recommend REML)

Per Bruun Brockhoff (perbb@dtu.dk) Mixed Linear Models, Module 4 Fall 2014 26 / 33 Test of random effects parameters

Test of random effects parameters

The likelihood ratio test can be applied to test A → B if B is a sub–model of A A the model including some variance parameter B the model without that variance parameter The test is calculated as: GA→B = 2ℓ(B)

re − 2ℓ(A) re

Asymptotically GA→B is a mixture of the χ2

0 and the χ2 1–distributions

So the P–value is: P(χ2

1 ≥ GA→B)/2

Per Bruun Brockhoff (perbb@dtu.dk) Mixed Linear Models, Module 4 Fall 2014 28 / 33

slide-7
SLIDE 7

Test of random effects parameters Confidence intervals for random effects parameters

Confidence intervals for random effects parameters

Three approaches could be used:

1 Standard Wald based CIs for parameters in any kind of statistical

models: ˆ θ ± 1.96SEˆ

θ

where SEˆ

θ comes as the square root of the corresponding diagonal

element of minus the inverse of the hessian of the log-likelihood. Not good for variances. Maybe OK for log-standard deviations

2 Use a χ2-based (Satterthwaite) approximation approach 3 Use ML/REML based profiling (The easiest with lmer) Per Bruun Brockhoff (perbb@dtu.dk) Mixed Linear Models, Module 4 Fall 2014 29 / 33 Test of random effects parameters Confidence intervals for random effects parameters

Confidence intervals for random effects parameters

We start by assuming that asymptotically: ˆ σ2

b ∼ σ2 d f χ2 d f

The 95% confidence interval takes the well known form:

d f ˆ σ2

b

χ2

0.025;d f

< σ2

b <

d f ˆ σ2

b

χ2

0.975;d f

, but we still don’t know d f

The (theoretical) variance is:

var σ2

b

d f χ2

d f

  • = 2σ4

b

d f

From the curvature of the likelihood we can estimate the actual variance of our estimate Matching these two things:

var(ˆ σ2

b) = 2σ4 b

d f

Solving for d f gives Satterthwaite’s approximation in this case:

ˆ d f = 2ˆ σ4

b

var(ˆ σ2

b)

Per Bruun Brockhoff (perbb@dtu.dk) Mixed Linear Models, Module 4 Fall 2014 30 / 33 The overall approach

The overall approach - REALLY:

Identify factors and their structure leading to starting model. Explorative analysis Decide on which effects to be random (consider if residual error structure is needed) FIRST: Test of RANDOM effects/model reduction leading to final RANDOM model part

REML based test (always OK) or: ML based test (always OK) or: F-tests coming from a model where a random effect is considered fixed (sometimes OK) NOTE: Sometimes this part is skipped because the structure is simple.

THEN: Test of FIXED effects/model reduction of leading to final model Post hoc analysis of fixed effects (as before) Model Diagnostics: ALSO (Module 6)

Per Bruun Brockhoff (perbb@dtu.dk) Mixed Linear Models, Module 4 Fall 2014 32 / 33 The overall approach

Overview of this module

1

Design Matrix Fixed model Mixed model

2

Mixed model Definition, Matrix form The likelihood function The REML method Likelihood Ratio tests Restricted Likelihood Ratio tests

3

Testing of FIXED effects Wald F–test (& Satterthwaite’s) Partial and sequential ANOVA Tables Confidence intervals of fixed effects

4

Test of random effects parameters Confidence intervals for random effects parameters

5

The overall approach

Per Bruun Brockhoff (perbb@dtu.dk) Mixed Linear Models, Module 4 Fall 2014 33 / 33