
SLIDE 1
CS171 Visualization
Alexander Lex alex@seas.harvard.edu
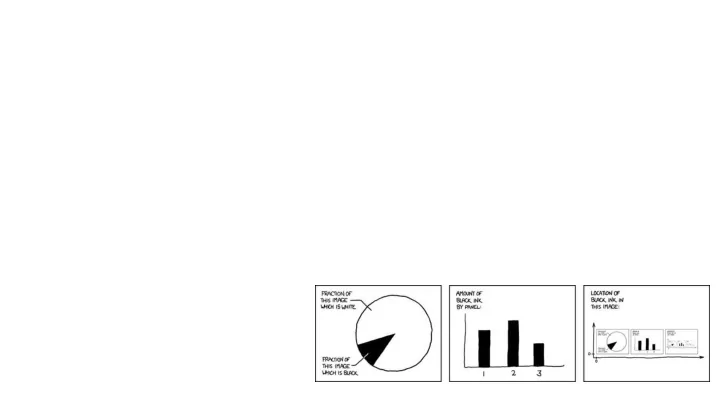
[xkcd]
The Visualization Alphabet: Marks and Channels
CS171 Visualization Alexander Lex alex@seas.harvard.edu The - - PowerPoint PPT Presentation
CS171 Visualization Alexander Lex alex@seas.harvard.edu The Visualization Alphabet: Marks and Channels [xkcd] This Week Thursday: Task Abstraction, Validation Homework 1 due on Friday! Any more problems with private GitHub repositories?
Alexander Lex alex@seas.harvard.edu
[xkcd]
The Visualization Alphabet: Marks and Channels
except when used for exercises
It’s better to take notes by hand Notifications are designed to grab your attention
what can be visualized?
fundamental units combinations make up Dataset Types
Tables
Attributes (columns) Items (rows) Cell containing value
Networks
Link Node (item)
Trees
Fields (Continuous)
Attributes (columns) Value in cell
Cell
Multidimensional Table
Value in cell
Grid of positions
Geometry (Spatial)
Position
Dataset Types
Data Types Items Attributes Links Positions Grids
each column is attribute unique (implicit) key no duplicates
indexing based on multiple keys
Item Values Keys Attributes
Keys: Patients Keys: Genes
Temperature, pressure, wind velocity
Signal processing & stats
Unique items, unordered
Ordered, duplicates allowed
Groups of similar items
Operations: =, ≠
Operations: =, ≠, >, <
Operations: =, ≠, >, <, +, − (distance)
Operations: =, ≠, >, <, +, −,×, ÷ (proportions)
On the theory of scales and measurements [S. Stevens, 46]
Item/Element/ (Independent) Variable
Attribute/ Dimension/ (Dependent) Variable/ Feature
Semantics
Basic geometric elements 3D mark: Volume, but rarely used
0D 2D 1D
[Riche & Dwyer, 2010]
Semiology of Graphics [J. Bertin, 67]
Points Lines Areas Marks:
Position Size (Grey)Value Texture Color Orientation Shape
Mark: Line Channel: Length/Position 1 quantitative attribute 1 categorical attribute Adding Hue +1 categorical attr. Adding Size +1 quantitative attr. Mark: Point Channel: Position 2 quantitative attr.
Length, Position and Value
Magnitude Channels: Ordered Attributes Identity Channels: Categorical Attributes Spatial region Color hue Motion Shape Position on common scale Position on unaligned scale Length (1D size) Tilt/angle Area (2D size) Depth (3D position) Color luminance Color saturation Curvature Volume (3D size) Channels: Expressiveness Types and Efgectiveness Ranks
What visual variables are used?
http://www.nytimes.com/interactive/2013/05/25/sunday-review/corporate-taxes.html
What visual variables are used?
Selective
Is a mark distinct from other marks? Can we make out the difference between two marks?
Associative
Does it support grouping?
Quantitative (Magnitude vs Identity Channels)
Can we quantify the difference between two marks?
Can we see a change in order?
How many unique marks can we make?
Sometimes not available (spatial data) Cluttering
[Spotfire]
For 1D length: Selective: yes Associative: yes Quantitative: yes Order: yes Length: high
Selective: yes Associative: yes Quantitative: somewhat (with problems) Order: yes Length: limited
minimize color use for encoding data use for brushing
Selective: yes Associative: yes Quantitative: no Order: no Length: limited
Cliff Mass
Selective: yes Associative: limited Quantitative: no Order: no Length: vast
Critique: https://eagereyes.org/criticism/chernoff-faces Does it work? Not really!
From Wilkinson 99, based on Stevens 61
Electric
A B
A B
A B
A B
A B
A B
A B
A B Unframed Aligned Framed Unaligned A B A B Unframed Unaligned
VS VS VS
William S. Cleveland; Robert McGill , “Graphical Perception: Theory, Experimentation, and Application to the Development of Graphical Methods.” 1984
Positions Rectangular areas
(aligned or in a treemap)
Angles Circular areas Cleveland & McGill’s Results Crowdsourced Results
1.0 3.0 1.5 2.5 2.0 Log Error 1.0 3.0 1.5 2.5 2.0 Log Error
[Mackinlay, Automating the Design of Graphical Presentations of Relational Information, 1986]
Decreasing
Magnitude Channels: Ordered Attributes Identity Channels: Categorical Attributes Spatial region Color hue Motion Shape Position on common scale Position on unaligned scale Length (1D size) Tilt/angle Area (2D size) Depth (3D position) Color luminance Color saturation Curvature Volume (3D size) Channels: Expressiveness Types and Efgectiveness Ranks
Visualization Analysis and Design, 2014