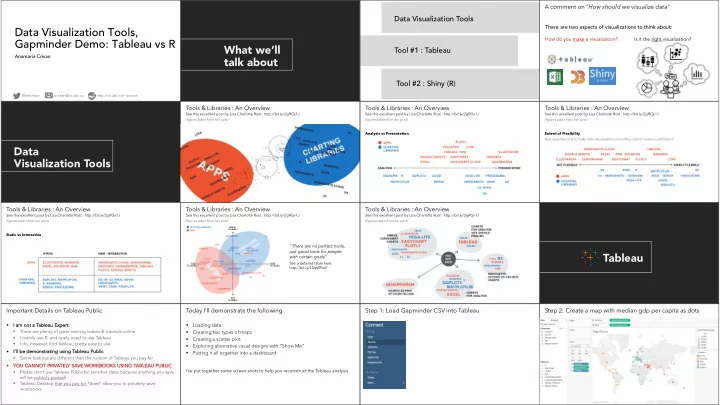

A comment on “ How should we visualize data” Data Visualization Tools There are two aspects of visualizations to think about: Data Visualization Tools, How do you make a visualization? Is it the right visualization? Gapminder Demo: Tableau vs R What we’ll Tool #1 : Tableau Anamaria Crisan talk about Tool #2 : Shiny (R) @amcrisan acrisan@cs.ubc.ca http://cs.ubc.ca/~acrisan Tools & Libraries : An Overview Tools & Libraries : An Overview Tools & Libraries : An Overview See this excellent post by Lisa Charlotte Rost : http://bit.ly/2gRGx1J See this excellent post by Lisa Charlotte Rost : http://bit.ly/2gRGx1J See this excellent post by Lisa Charlotte Rost : http://bit.ly/2gRGx1J (figures taken from her post) (figures taken from her post) (figures taken from her post) Analysis vs Presentation Extent of Flexibility How easy/hard it is to make data visualizations (including custom/novel visualizations) Data Visualization Tools Tools & Libraries : An Overview Tools & Libraries : An Overview Tools & Libraries : An Overview See this excellent post by Lisa Charlotte Rost : http://bit.ly/2gRGx1J See this excellent post by Lisa Charlotte Rost : http://bit.ly/2gRGx1J See this excellent post by Lisa Charlotte Rost : http://bit.ly/2gRGx1J (figures taken from her post) (figures taken from her post) (figures taken from her post) Static vs Interactive “There are no perfect tools, just good tools for people Tableau with certain goals” See a detailed table here: http://bit.ly/2DeWPwV Important Details on Tableau Public Today I’ll demonstrate the following Step 1: Load Gapminder CSV into Tableau Step 2: Create a map with median gdp per capita as dots § I am I am n not a T a Tab able leau au E Expert § Loading data § There are plenty of great training videos & tutorials online Creating two types of maps § § I mainly use R, and rarely need to use Tableau Creating a scatter plot § I do, however, find Tableau pretty easy to use § Exploring alternative visual designs with “Show Me” § I’ I’ll b ll be d demonstrat atin ing u usin ing T Tab able leau au P Public lic § § Putting it all together into a dashboard § Some features are different than the version of Tableau you pay for § YOU CANNOT PRIVATELY SAVE WORKBOOKS USING TABLE LEAU PUBLI LIC I’ve put together some screen shots to help you reconstruct the Tableau analysis § Please don’t use Tableau Public for sensitive data, because anything you save will be publicly posted! Tableau Desktop that you pay for *does* allow you to privately save § workbooks
Step 2: Create a map with median gdp per capita as dots Step 3: Create a small multiples choropleth map Step 3: Create a small multiples choropleth map Step 3: Create a small multiples choropleth map A: Drag Dimensions B: Set gpdPerCaptial to median B: Create a new group A: Drag Dimensions B: Create a new group & measures to marks (sum is default) & measures to marks Same as before New! Step 4: Create a scatter plot Step 5: Explore the ShowMe panel Step 6: Create a dashboard Try it on your own Try it on your own Create a filter See more online at the Tableau Public gallery! https://public.tableau.com /en-us/s/gallery Important Details on R and Shiny The Challenges of Briefly Introducing Shiny What is Shiny? § To introduce shiny, I am using selected slide content from several To pr presenta tati tions de develope ped d for r th the “Shi hiny ny qui uick st start gui uide” e” available e her here: e: § Shiny is powerful and Part 1: bit.ly/shiny-quickstart-1 Pa § somewhat simpler than web Pa Part 2: bit.ly/shiny-quickstart-2 § languages - but it still takes Th These quick start slides are also o presented as a video o on on the Shiny website § some time to learn it Shiny https://shiny.rstudio.com/tutorial/ § § I want to show you some + basic info, and give you a sense of what Shiny can do - but there is a lot of in between I won’t cover Presentation, Most glorious of Basic Structure Webpage / Application Layouts, programming languages Behavior formatting How Does Shiny Work? Basic Structure of a Shiny Application Basic Structure of a Shiny Application The user interface (ui.r) houses inputs & outputs Example of inputs An entire application can be a single file, or broken down into a ui.R & server.R files User Interface (UI) Server runs R code bit.ly/shiny-quickstart-1 bit.ly/shiny-quickstart-1 You must use app.r (single file); or ui.r and server.r names, or your application won’t run
The user interface (ui.r) houses inputs & outputs The user interface (ui.r) houses inputs & outputs server.r stiches inputs & outputs together A simple worked example Example of inputs Example of outputs server.r Output & render functions ui.r ggplot code are complimentary Shiny widgets dataset manipulation Interface elements output render function function plotOutput( ) renderPlot( ) input tableOutput( ) renderTable( ) render Changing the slider number (i.e. dragging the circle left to right) causes R to output automatically initiate an action to update all outputs that use the slider number. bit.ly/shiny-quickstart-1 Function = command telling R & shiny to do some particular task bit.ly/shiny-quickstart-1 Reactivity in Shiny – a Very Brief Introduction Reactivity in Shiny – a Very Brief Introduction See more online Let’s go through a more at the Shiny complex example Gallery! https://www.rstudio.com /products/shiny/shiny- user-showcase/ bit.ly/shiny-quickstart-1 bit.ly/shiny-quickstart-1 bit.ly/shiny-quickstart-1
Recommend
More recommend