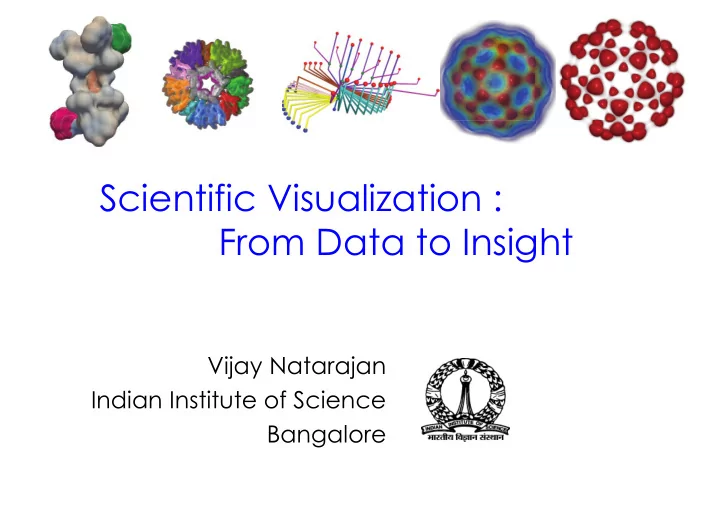

Scientific Visualization : From Data to Insight Vijay Natarajan Indian Institute of Science Bangalore
What is Visualization? » http://en.wikipedia.org/wiki/Visualization » Creative Visualization » “Creative Visualization is the cognitive process of purposefully generating visual mental imagery, with eyes open or closed …” » … day dreaming Vijay Natarajan CSA Summer School, July 2017 3
What is Visualization? » Visual representation of data (https://en.wiktionary.org/wiki/visualization) » Data ! Pictures » Scientific Visualization » Scientific (Data) Visualization Vijay Natarajan CSA Summer School, July 2017 4
Scientific Data Density distribution in Silicium NIR microscopy Atomistic simulations (Pore networks) CT / MRI Electron microscopy » Source: Simulations, measurement from imaging devices, sensing devices » Focus: Scalar data f : D " R Vijay Natarajan CSA Summer School, July 2017 5 !
Scientific Data Visualization » Aim: Study and develop methods to " Understand underlying phenomena " Communicate (research) findings » Application domains " medical imaging " x-ray crystallography " structural biology " computational fluid dynamics " climate science " material science " geology, cosmology , … Vijay Natarajan CSA Summer School, July 2017 6
Visualization Pipeline [dos Santos, S. and Brodlie, K., Gaining understanding of multivariate and multidimensional data through visualization, Computers & Graphics, 28(3), 311–325, 2004.] Vijay Natarajan CSA Summer School, July 2017 #7
Visualization : Current Challenges » Large data sizes » Feature-rich data » Integrated analysis vacet.sci.utah.edu and visualization " Visual abstractions " Intuitive exploration [Doraiswamy and Natarajan, IEEE Trans. Visualization and Computer Graphics , 2013] Vijay Natarajan CSA Summer School, July 2017 8
Scalar Field Visualization - 2D f : R 2 " R • Surface plot • interpret scalar value as height • Color mapping ! • assign a color to scalar values • Contour plot • extract curves as pre-image of given scalar value Source: Wikipedia Vijay Natarajan CSA Summer School, July 2017 9
Isosurface Preimage of an isovalue: Isocontours and Isosurfaces Source: Wikipedia Vijay Natarajan CSA Summer School, July 2017 10
Scalar Field Visualization Isosurfacing for Volume data Foot from Visible Human Data [US NIH and NLM] Vijay Natarajan CSA Summer School, July 2017 11
Isosurfaces Vijay Natarajan CSA Summer School, July 2017 12
Isosurfaces Isosurfaces Vijay Natarajan CSA Summer School, July 2017 13
Isosurfaces Vijay Natarajan CSA Summer School, July 2017 14
Isosurfaces Isosurfaces Vijay Natarajan CSA Summer School, July 2017 15
Isosurface Topology Maximum Saddle Saddle Minimum Critical Points Vijay Natarajan CSA Summer School, July 2017 16
Topological Structures : Reeb Graph
Reeb Graphs Georges Henri Reeb Vijay Natarajan CSA Summer School, July 2017 18
Contour Tree » Loop-free Reeb graph » Degree-1 and Degree-3 nodes » How many trees with 1 minimum and 4 maxima? » 1 minimum and 0 maxima? Vijay Natarajan CSA Summer School, July 2017 19
[Doraiswamy and Natarajan, IEEE Trans. Visualization and Computer Graphics , 2013] Highlight bones/organs via Reeb graph Topological Structures as Abstract Representations Pore Networks from MS Complex [Gyulassy, Natarajan, et al. IEEE Trans. Visualization and Computer Graphics , 2007] Vijay Natarajan CSA Summer School, July 2017 20
Mapping to the Volume » Arcs in Reeb graph map to cylinders in domain » Use Reeb graph as an abstract interface into scalar volume Vijay Natarajan CSA Summer School, July 2017 21
Computing Reeb Graph » Split-and-compute strategy (2011) • 10 times faster than earlier methods • 4-6 million elements in 4-6 sec » Parallel algorithm (2015) • 8.6 billion points in 3 min on 64 cores • Requires 10GB only Vijay Natarajan CSA Summer School, July 2017 22
Simplification + Multiresolution Simplification threshold = 0.005 Simplification threshold = 0.01 Input may contain noise or small- sized features Vijay Natarajan CSA Summer School, July 2017 23
(Topological) Feature- directed Visualization
Application 1: Transfer Function Design Topology controlled volume rendering [Weber et al., IEEE TVCG 2007] Spatially aware transfer function design [Doraiswamy and Natarajan, IEEE TVCG 2011] Movie at 2x Vijay Natarajan CSA Summer School, July 2017 25
Application 2: Interactive Exploration of Time-Varying Data [Doraiswamy and Natarajan, IEEE Trans. Visualization and Computer Graphics , 2011] Vijay Natarajan CSA Summer School, July 2017 26
Application 2: Interactive Exploration of Time-Varying Data [Doraiswamy and Natarajan, IEEE Trans. Visualization and Computer Graphics , 2011] Vijay Natarajan CSA Summer School, July 2017 27
Application 3: Segmentation Reeb graph-directed surface segmentation [Doraiswamy and Natarajan, IEEE Trans. Visualization and Computer Graphics , 2011] Vijay Natarajan CSA Summer School, July 2017 28
Application 4: Isosurface Selection Flexible isosurfaces [Carr et al., IEEE VIS 2004] Extracting and tracking cloud systems [Doraiswamy, Natarajan, and Nanjundiah. IEEE Trans. Visualization and Computer Graphics , 2013] Vijay Natarajan CSA Summer School, July 2017 29
Application 5: Symmetry in Scientific Data » Detect similar subtrees within contour tree [Thomas and Natarajan, Symmetry in scalar field topology, IEEE TVCG 2011] Vijay Natarajan CSA Summer School, July 2017 30
5: Symmetry-aware transfer function design Adenovirus Ribonucleoprotein Bacteriophage Flagella Bacteriophage Vijay Natarajan CSA Summer School, July 2017 31
5: Symmetry-Aware Transfer Function Design Vijay Natarajan CSA Summer School, July 2017 32
Acknowledgements Department of Science " and Technology, India Intel " Robert Bosch Centre for " Cyber-Physical Systems, IISc Visualization and Graphics Lab Indian Institute of Science Vijay Natarajan CSA Summer School, July 2017 33
Summary » Challenges in visualization » Feature-directed visualization » Abstract / topology-based representations based representations » Efficient computation of topological structures " Parallel (GPU / Hybrid) algorithms " Memory efficient » New applications!! » Webserver and libraries at http://vgl.csa.iisc.ac.in : VGLIISc Vijay Natarajan CSA Summer School, July 2017 34
Recommend
More recommend