
SLIDE 1
CS171 Visualization
Alexander Lex alex@seas.harvard.edu
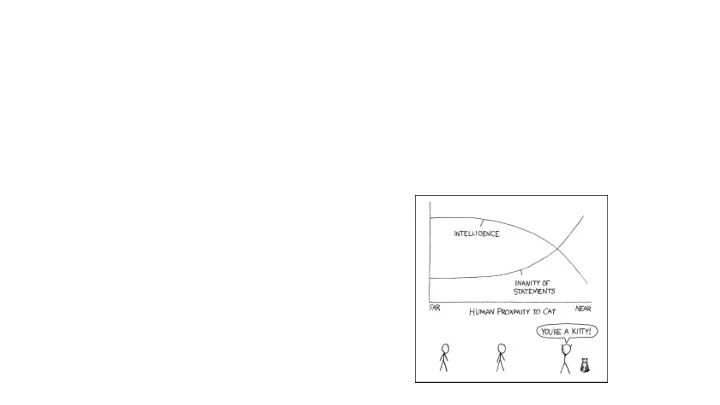
[xkcd]
CS171 Visualization Alexander Lex alex@seas.harvard.edu [xkcd] vi - - PowerPoint PPT Presentation
CS171 Visualization Alexander Lex alex@seas.harvard.edu [xkcd] vi su al i za tion 1. Formation of mental visual images 2. The act or process of interpreting in visual terms or of putting into visible form The American
Alexander Lex alex@seas.harvard.edu
[xkcd]
vi·su·al·i·za·tion
visual images
visual terms or of putting into visible form
The American Heritage Dictionary
Visualization is the process that transforms (abstract) data into interactive graphical representations for the purpose of exploration, confirmation, or presentation.
How did the unemployment and labor force develop over the last years?
Which combination of genes causes cancer? Which drug can help patient X?
[New York Times]
Communication Open Exploration
[Obama Administration]
Confirmation
[New York Times]
[Caleydo StratomeX]
Figures are richer; provide more information with less clutter and in less space. Figures provide the gestalt effect: they give an overview; make structure more visible. Figures are more accessible, easier to understand, faster to grasp, more comprehensible, more memorable, more fun, and less formal.
list adapted from: [Stasko et al. 1998]
Which gene is most frequently mutated in this set of patients? What is the current unemployment rate?
High frequency stock market trading: which stock to buy/sell? Manufacturing: is bottle broken?
Drawing by hand infeasible Interaction allows to “drill down” into data Integration with algorithms
[Sunburst by John Stasko, Implementation in Caleydo by Christian Partl]
Re-use charts for different datasets
Precise data driven rendering
Use time
[New York Times]
I x y 10 8.0 8 6.9 13 7.5 9 8.8 11 8.3 14 9.9 6 7.2 4 4.2 12 10. 7 4.8 5 5.6 II x y 10 9.1 8 8.1 13 8.7 9 8.7 11 9.2 14 8.1 6 6.1 4 3.1 12 9.1 7 7.2 5 4.7 III x y 10 7.4 8 6.7 13 12. 9 7.1 11 7.8 14 8.8 6 6.0 4 5.3 12 8.1 7 6.4 5 5.7 IV x y 8 6.5 8 5.7 8 7.7 8 8.8 8 8.4 8 7.0 8 5.2 19 12. 8 5.5 8 7.9 8 6.8
Mean x: 9 y: 7.50 Variance x: 11 y: 4.122 Correlation x – y: 0.816 Linear regression: y = 3.00 + 0.500x
Mean x: 9 y: 7.50 Variance x: 11 y: 4.122 Correlation x – y: 0.816 Linear regression: y = 3.00 + 0.500x
Milestones Project
Anaximander of Miletus, c. 550 BC Konya town map, Turkey, c. 6200 BC
The Galileo Project, Rice University
Galileo Galilei, 1616 Leonardo Da Vinci, ca. 1500
The History of Visual Communication
William Curtis (1746-1799)
Donald Norman
Halley’s Wind Map, 1686 Planetary Movement Diagram, c. 950
wikipedia.org
Visual Explanations, 1997
John Snow, 1854
C.J. Minard, 1869
London Subway Map, 1927
Harry Beck, 1933
New York Times, 2010
Jerome Cukier, D3 Writeup About the Map
Ivan Sutherland, Sketchpad, 1963 Doug Engelbart, 1968
Hans Rosling, TED 2006
15 Exabytes in Punch Cards: 4.5 km over New England
http://onesecond.designly.com/
Hal Varian, Google’s Chief Economist The McKinsey Quarterly, Jan 2009
Daniel J. Simons and Daniel T. Levin, Failure to detect changes to people during a real world interaction, 1998
Males Females Income Group Under 65 65 or Over Under 65 65 or Over 0-$24,999 250 200 375 550 $25,000+ 430 300 700 500
Which gender or income level group shows different effects of age on cholesterol levels?
Slide after Stephen Kosslyn, Clear and to the Point
Triglyceride Level
175 350 525 700 Under 65 65 or Over
0-$24,999 $25,000+ 0-$24,999 $25,000+
Males Females
Slide after Stephen Kosslyn, Clear and to the Point
The History of Visual Communication
Donald A. Norman
The History of Visual Communication The History of Visual Communication
Idea Maps, by Jamie Nast Visual Thinking Collection, Dave Grey
“Visualization is really about external cognition, that is, how resources outside the mind can be used to boost the cognitive capabilities of the mind.”
Twitter: @alexander_lex
Dr. Verena Kaynig
Gaurav Bharaj Daniel Haehn Nam Wook Kim
Fellow, Visual Computing Group David Chouinard - Research Associate, Disney Research
Visual Computing Group
Fellow, Center for International Development Luciano Arango - A.B. candidate in Computer Science Samuel Gratzl - PhD Student, Johannes Kepler University Mohammad K. Hadhrawi - Graduate Student Research Assistant, MIT Media Lab Daniel Haehn - PhD Student, Visual Computing Group Alain Ibrahim - Senior Web Developer Benjy Levin - Computer Science Concentrator Andrew Mauboussin - Computer Science Concentrator Kevin Sun - A.B. candidate in Applied Math
Visual Computing Group Mimi Lai
except when used for exercises
It’s better to take note by hand Notifications are designed to grab your attention
Office Hours starting next week Piazza https://piazza.com/harvard/cs171 E-Mail staff@cs171.org alex@seas.harvard.edu
Lecture Reading Discussion Design Lecture Design Studios Sections D3 reading Self-study Office hours
Sections
https://www.section.fas.harvard.edu/sectioning/ Group 1: Mo 02:00-03:30, NW B150 Group 2: Mo 04:00-05:30, NW B150 Group 3: Tu 04:30-06:00, MD 123 Group 4: Tu 05:30-07:00, MD 223 Group 5: We 10:00-11:30, MD 223 Group 6: We 03:30-05:00, NW B150 Online Students:
C, C++, Java, Python, etc.
This can be time consuming
Engineering vs Computer Science
Varying value, 2%-14%, depending on length/difficult Start early! Will take long if you don’t know JS/D3 yet Due on Fridays, four late days
Teams, two milestones
Lectures and Sections: attendance appreciated but not required Design Studios & Guest Lectures: attendance mandatory
D3 Book, Chapters 1-4 VDA Book, Chapter 1
github, HTML / CSS, DOM Office hours start!
Sign up for GitHub now!
https://github.com/CS171/2015-cs171-homework