Air quality forecasting in Europe Forecasting emissions - - PowerPoint PPT Presentation

air quality forecasting in europe
SMART_READER_LITE
LIVE PREVIEW

Air quality forecasting in Europe Forecasting emissions - - PowerPoint PPT Presentation

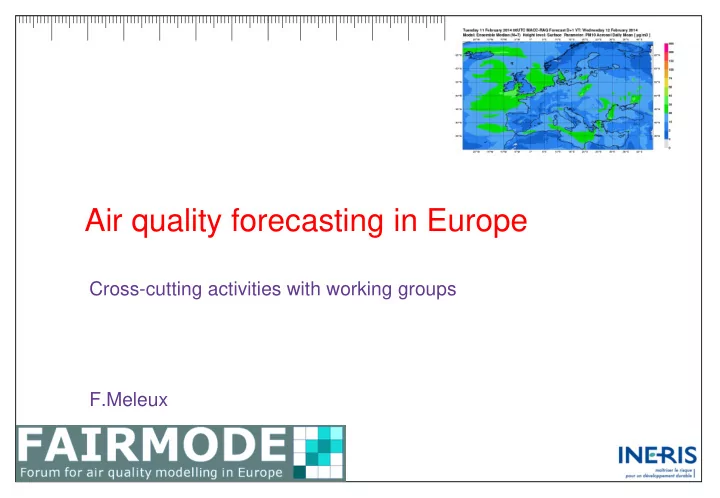
Air quality forecasting in Europe Forecasting emissions Cross-cutting activities with working groups F.Meleux DCO - 08/09/2004 - titre - 1 Objectives of air quality forecasting systems provide every day information related to the air


slide-1
SLIDE 1

DCO - 08/09/2004 - titre - 1

Forecasting emissions

Air quality forecasting in Europe

Cross-cutting activities with working groups F.Meleux

slide-2
SLIDE 2

DCO - 08/09/2004 - titre - 2

Objectives of air quality forecasting systems

  • provide every day information related to the air quality levels
  • targetted pollutants: O3,NO2,PM10,PM2.5
  • In case of pollution episode:
  • Provide information to the public
  • Support to policy users

– to identify the likely causes – to assess population exposure – to set-up the efficient measures (short term action plans)

slide-3
SLIDE 3

DCO - 08/09/2004 - titre - 3

Cascade of air quality forecasts at various scale

Global Europe National Local Urban it's now possible to bridge the scale in forecast mode by nesting models at various scale

slide-4
SLIDE 4

DCO - 08/09/2004 - titre - 4

Global forecasts

Provide the long range transport of pollutants

  • O3, NOx, HCHO, NH3, VOCs..., PM (Dust, Sea salt, BC/OC …)
  • Low horizontal resolution ( ~ 80 x 80 km2)
  • Boundary conditions to regional models
  • Large scale events (dust storm, biomass burning plumes…)
  • Available every D-1 up to 5 days ahead
slide-5
SLIDE 5

DCO - 08/09/2004 - titre - 5

Regional platforms

  • Provide background concentrations for O3,NO2,CO,SO2 and

PMs (concentrations and chemical speciation) from D+0 to D+3

  • Rely on chemical transport model used at different resolution to

cover the European scale, the national scale and the local scale

  • High horizontal resolution ( ~ 10 x 10 km2; 5 x 5 km2; 2 x 2

km2)

  • Produce analyse (D-1) resulting from a combination model-
  • bservations
slide-6
SLIDE 6

DCO - 08/09/2004 - titre - 6

MACCII regional forecasts over Europe

  • Based on an ensemble of 7 European models using the same input

data (met, emissions, boundary conditions)

Current geometry

EURAD

FRIUUK

15km, L23, top : 100hpa

EMEP

met.no

0.25 x0.125 , L20, top : 100hpa

CHIMERE

INERIS, CNRS

0.1 , L8, top : 500hpa

L-EUROS

TNO, KNMI

0.25 x0.125 , L4, top : 3.5km

MATCH

SMHI

0.2 , L40, top : 100hpa

MOCAGE

MF, CERFACS

0.2 , L47, top : 5hpa

SILAM

FMI

0.2 , L46/8, top : 100hpa Optimal Interpolation Variational 3d-var Variational, 3d-var Ensemble Kalman Filter Variational, 3d-var Variational, 3d-var Variational, 4d-var Assimilation method

slide-7
SLIDE 7

DCO - 08/09/2004 - titre - 7

Input data for air quality forecasting

  • Emissions:
  • Anthropogenic emissions inventories:
  • European EI ex:TNO (7x7 km2); national (1 x 1 km2)
  • Additional processing to modulate the emissions taking into

account the impact of meteorological conditions – ex: domestic heating

  • Natural emissions calculated on-line by the chemical transport

model (Biogenic emissions, dust emissions ...)

  • Support from the satellite observations to get near real time

emissions (biomass burning)

slide-8
SLIDE 8

DCO - 08/09/2004 - titre - 8

AQ forecasts & observations

  • Observation datasets are used:
  • for evaluating forecast performances
  • Near real time in-situ data from EEA
  • for assimilation processing and forecast corrections
  • Supplementary databases (satellite, lidar, photometer ...) can be

used for assimilation

slide-9
SLIDE 9

DCO - 08/09/2004 - titre - 9

Quality of the forecasts (web products): daily verification against representative surface observations selected using Joly and Peuch (Atmos. Env. 2012) classification

03 UTC/15 UTC Date selection Statistics selection Species selection Duration

AQ forecast evaluations on a daily basis

slide-10
SLIDE 10

DCO - 08/09/2004 - titre - 10

Additional statistical verification of model forecasts and ensemble done a posteriori: 6-monthly reports

slide-11
SLIDE 11

DCO - 08/09/2004 - titre - 11

Air quality forecasts: A support to policy user

Evaluation of the model forecasts in detecting threshold exceedances

slide-12
SLIDE 12

DCO - 08/09/2004 - titre - 12

  • help policy users in the design of relevant policy responses
  • provide daily regular information on the expected effect that

short term measures may have on the forecasted pollution episodes.

  • 4 Control scenarios: traffic; domestic heating; agricultural; industrial

Air quality forecasts: A support to policy user

Gr Green scenar nario ios s toolb lbox

slide-13
SLIDE 13

DCO - 08/09/2004 - titre - 13

  • help policy users in the design of relevant policy responses
  • provide daily regular information on the expected effect that

short term measures may have on the forecasted pollution episodes.

  • 1 policy scenario: Gothenburg protocol

Air quality forecasts: A support to policy user

Gr Green scenar nario ios s toolb lbox

slide-14
SLIDE 14

DCO - 08/09/2004 - titre - 14

Air quality forecasts: A support to policy user

Sourc rce-recepto receptor ca calculati culations

  • ns

Two type of calculations, either country or regional This regional SR daily run assess the contributions of local sources versus remote sources to the PM10 concentrations.

  • Paris, Oslo
slide-15
SLIDE 15

DCO - 08/09/2004 - titre - 15

Fairmode

Objectives:

  • add supplementary evaluation process associated to

forecast products

  • Assessment:
  • What are the best indicators to evaluate the skill of a forecast model?
  • Persistence of the model capability along the forecast duration
  • Specific indicators for threshold exceedances (MQO)
  • Emissions:
  • Implementation in the model of forecasting emissions?
  • Planning
  • How forecasts of control scenarios can be used ?