
SLIDE 1
AIR QUALITY UPDATE CLEAN AIR ACT AMBIENT AIR QUALITY STANDARDS - - PowerPoint PPT Presentation
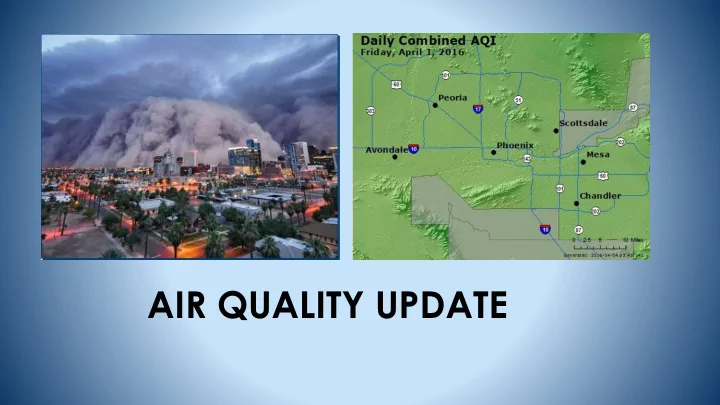
AIR QUALITY UPDATE CLEAN AIR ACT AMBIENT AIR QUALITY STANDARDS Carbon Monoxide Lead Nitrogen Dioxide Ozone Particulate Matter (PM10) and (PM2.5) Sulfur Dioxide (Source: U.S. EPA, Air Quality Trends, 2016.)
(Source: U.S. EPA, Air Quality Trends, 2016.)
CARBON MONOXIDE MONITORING DATA
CO (8-hour average, ppm)
2 4 6 8 10 12 14 16 18 20
8-hour standard = 9.4 (ppm)
80 ppb 1997 75 ppb 2008 70 ppb 2015
120 100 100 90 80 70 60 50 40
50 100 150 200 250 300 350 400 2008 2009 2010 2011 2012 2013 2014
PM-10 24-hr Max Value West 43rd Ave Monitor Contrasting Exceptional Events
W 43rd W 43rd w/o EE
NAAQS 150 µg/m3
2008 2009 2010 2011 2012 2013 2014
PM-2.5 Annual Average µg/m3) 2 Monitors in or Near District 8
Durango S PHX
Durango began 2010
NAAQS 12 µg/m3
Maps air quality presentation5.pptx
particulate matter and
Asthma as a health impact Education and school
Mulch fires and outdoor combustibles Climate Change