
SLIDE 1
9/30/2015 1
Detecting oestrus by monitoring sows’ visits to a boar
- T. Ostersen, C. Cornou, A.R. Kristensen
Katarina Nielsen Dominiak Department of Large Animal Sciences
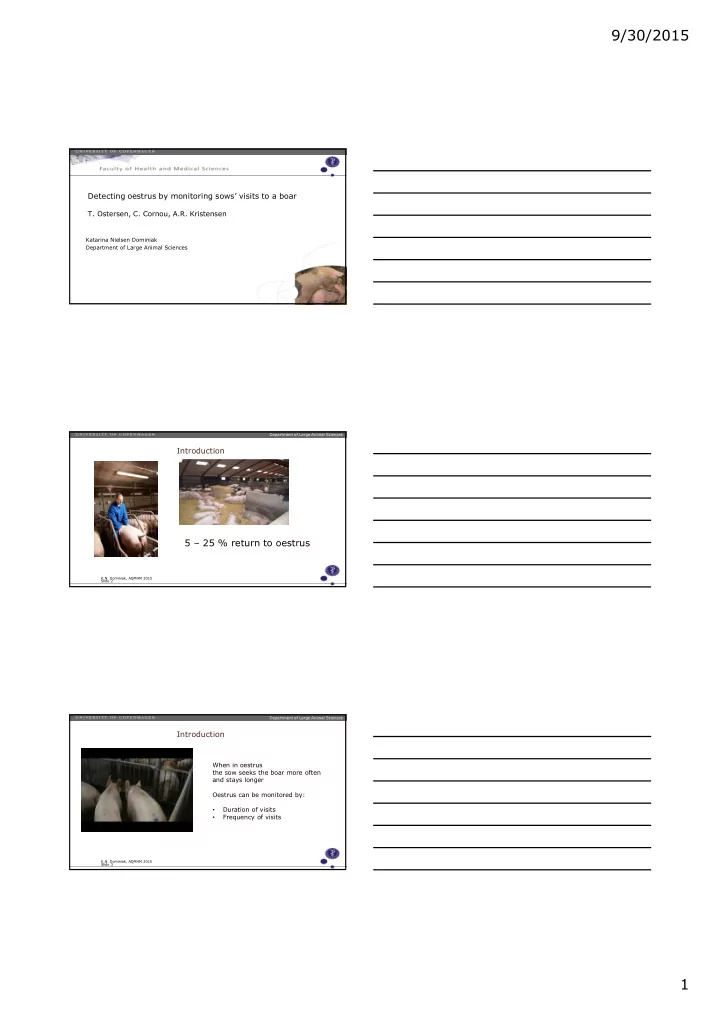
Introduction
K.N. Dominiak, AQMHM 2015 Department of Large Animal Sciences Slide 2
5 – 25 % return to oestrus
Introduction
Department of Large Animal Sciences K.N. Dominiak, AQMHM 2015 Slide 3
When in oestrus the sow seeks the boar more often and stays longer Oestrus can be monitored by:
- Duration of visits
- Frequency of visits