
SLIDE 1
5/29/2015 1
2015 Joint 2015 Joint PIE PIE / BUDGE BUDGET Meeting Meeting
Ma May 28, 2015 y 28, 2015
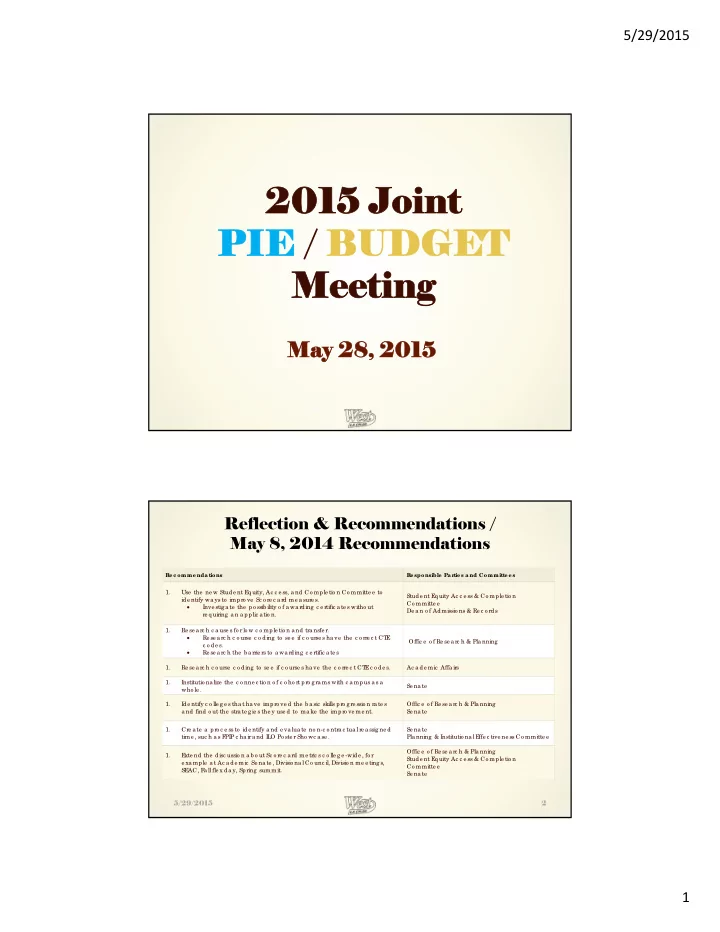
Reflection & Recommendations / May 8, 2014 Recommendations
R e c omme ndations R e sponsible Par tie s and Committe e s 1. Use the ne w Stude nt E q uity, Ac c e ss, a nd Co mple tio n Co mmitte e to ide ntify wa ys to impro ve Sc o re c a rd me a sure s. Inve stig a te the po ssib ility o f a wa rding c e rtific a te s witho ut re q uiring a n a pplic atio n. Stude nt E q uity Ac c e ss & Co mple tio n Co mmitte e De a n o f Admissio ns & Re c o rds 1. Re se a rc h c a use s fo r lo w c o mple tio n a nd tra nsfe r. Re se a rc h c o urse c o ding to se e if c o urse s ha ve the c o rre c t CT E c o de s. Re se a rc h the b a rrie rs to a wa rding c e rtific a te s Offic e o f Re se a rc h & Pla nning 1. Re se a rc h c o urse c o ding to se e if c o urse s ha ve the c o rre c t CT E c o de s. Ac a de mic Affa irs 1. Institutio nalize the c o nne c tio n o f c o ho rt pro g ra ms with c a mpus a s a who le . Se na te 1. Ide ntify c o lle g e s tha t ha ve impro ve d the b a sic skills pro g re ssio n ra te s a nd find o ut the stra te g ie s the y use d to ma ke the impro ve me nt. Offic e o f Re se a rc h & Pla nning Se na te 1. Cre a te a pro c e ss to ide ntify a nd e va lua te no n-c o ntrac tua l re a ssig ne d time , suc h a s F PIP c ha ir a nd IL O Po ste r Sho wc ase . Se na te Pla nning & Institutio nal E ffe c tive ne ss Co mmitte e 1. E xte nd the disc ussio n a b o ut Sc o re c a rd me tric s c o lle g e -wide , fo r e xa mple a t Ac a de mic Se na te , Divisio nal Co unc il, Divisio n me e ting s, SE AC, F a ll fle x da y, Spring summit. Offic e o f Re se a rc h & Pla nning Stude nt E q uity Ac c e ss & Co mple tio n Co mmitte e Se na te 5/29/2015 2