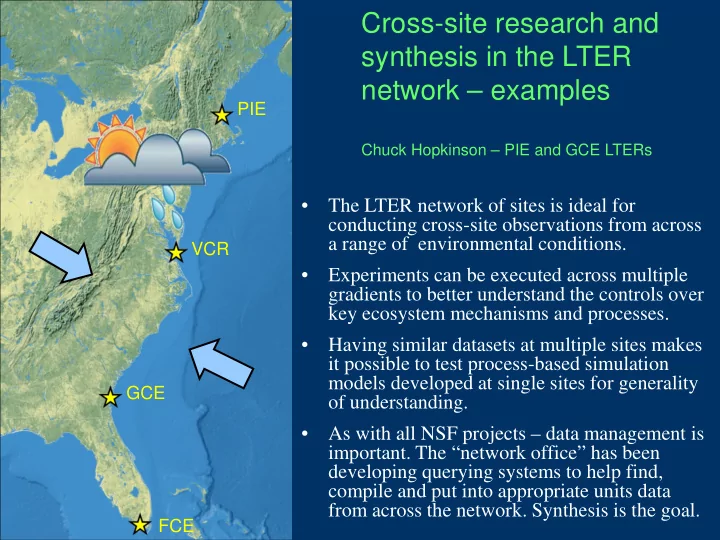
Cross-site research and synthesis in the LTER network examples - - PowerPoint PPT Presentation

cross site research and synthesis in the lter network
SMART_READER_LITE
LIVE PREVIEW

Cross-site research and synthesis in the LTER network examples - - PowerPoint PPT Presentation

Cross-site research and synthesis in the LTER network examples PIE Chuck Hopkinson PIE and GCE LTERs The LTER network of sites is ideal for conducting cross-site observations from across a range of environmental conditions. VCR


slide-1
SLIDE 1

GCE FCE VCR PIE

Cross-site research and synthesis in the LTER network – examples

Chuck Hopkinson – PIE and GCE LTERs

  • The LTER network of sites is ideal for

conducting cross-site observations from across a range of environmental conditions.

  • Experiments can be executed across multiple

gradients to better understand the controls over key ecosystem mechanisms and processes.

  • Having similar datasets at multiple sites makes

it possible to test process-based simulation models developed at single sites for generality

  • f understanding.
  • As with all NSF projects – data management is
  • important. The “network office” has been

developing querying systems to help find, compile and put into appropriate units data from across the network. Synthesis is the goal.

slide-2
SLIDE 2

Example 1: Coastal SEES: Wetland Vulnerability to Sea-level Rise

McGlathery, Alber, Giblin, Johnston, Kirwan, Wiberg, Morris, Alexander, Polsky

How will feedbacks between marsh response to SLR and human adaptation responses affect sustainability of the socio-ecological system?

GCE VCR PIE

slide-3
SLIDE 3

Coastal SEES: Wetland Vulnerability to Sea-level Rise

1) how marsh vulnerability to current and projected SLR, with and without adaptation actions, compares across biogeographic provinces and a range of biophysical and social drivers 2) which marsh protection actions local stakeholder groups favor, and what are the broader sustainability and economic value implications of feasible adaptation options.

slide-4
SLIDE 4

Coastal SEES: Wetland Vulnerability to Sea-level Rise

Plausible scenarios of historically stable marshes under future SLR

(A) Threshold rates of SLR crossed, uplands are armored to prevent marsh transgression. Rates of marsh loss are rapid (e.g. PIE). (C) Threshold rates of SLR crossed, but rapid marsh loss spurs adaptive management (dam removal, managed transgression) that allows some marshes to persist. (D) Threshold rates of SLR not crossed, or marsh transgression balances marsh loss (e.g. VCR). (B) Threshold rates of SLR crossed, uplands armored, but physical factors slow marsh loss (e.g. GCE). (E) Threshold rates of SLR not crossed, marsh transgression exceeds marsh loss.

slide-5
SLIDE 5

Example 2: Controls of Terrestrial Productivity

slide-6
SLIDE 6

Each site shows a linear response to water availability. Only through cross-site research was this basic non-linear functional understanding revealed.

  • Water availability limits plant growth

in all terrestrial systems, but biomes differ in sensitivity of ANPP to precipitation

  • In years when water is most limiting,

all terrestrial systems exhibit the same rate of ANPP per unit rainfall, despite differences in physiognomy.

Huxman et al.

slide-7
SLIDE 7

Example 3: Long-term Intersite Decomposition Experiment Team (LIDET)

A 10-year field study testing the degree to which substrate quality and climate control the long-term carbon and nitrogen dynamics of decomposing leaf and fine root litter. LIDET employed a standardized methodology at 27sites to examine decomposition patterns

  • f 30 species of litter.

Source: M. E. Harmon and LIDET

Leaf litter bags Root litter bags

slide-8
SLIDE 8

Example 4: Detritus Inputs & Forest Soil Organic Matter Formation: Is There a Linear Relationship Between Detrital Input Rates and Soil Carbon Accumulation?

816 Pg C 1417 Pg C 497 Pg C

Global Atmospheric, Biomass and Soil Carbon Pools

Source: Nadelhoffer for DIRT

slide-9
SLIDE 9

Multifactor experiment conducted at multiple sites in US and Europe

Will increases in NPP translate into increased soil organic carbon storage?

slide-10
SLIDE 10

Example 5: What city is this: Phoenix or Boston?

Source: Groffman for Urban Homogenization

slide-11
SLIDE 11

Six study cities, 14 co- pi’s, 11 institutions:

  • Why do our cities look

so similar?

  • What are the effects of

this urban homogenization on:

– Biodiversity – Soil biogeochemistry (carbon, nitrogen) – Hydrography – Microclimate – Quality of life

slide-12
SLIDE 12

Cross-site analysis of LTER time series data from 4 sites to:

1) Assess analytically whether & when abrupt transitions occurred 2) Evaluate proposed methods of forecasting abrupt shifts 3) Seek evidence of hysteresis Example 6: General understanding of abrupt state shifts

California Current Ecosystem LTER Palmer Station Antarctica LTER Santa Barbara Coastal LTER

JRN LTER

Jornada Basin LTER

Source: Schmitt for the team

slide-13
SLIDE 13

Evidence for mode of the abrupt transition (e.g., Hysteresis)

Examined relationships between response & driver variables

Likely mode

JRN LTER

Sea Cucumber Penguins Black Grama Grass Krill

Hysteresis mechanism?

(identified by LTER studies)

Positive predation- mediated feedback Positive feedback between soil erosion & low grass cover Positive predator- & breeding-mediated feedbacks

slide-14
SLIDE 14

U.S. LTER Network 25 sites representing diverse biomes, including

terrestrial, aquatic, & human-dominated ecosystems

Questions?