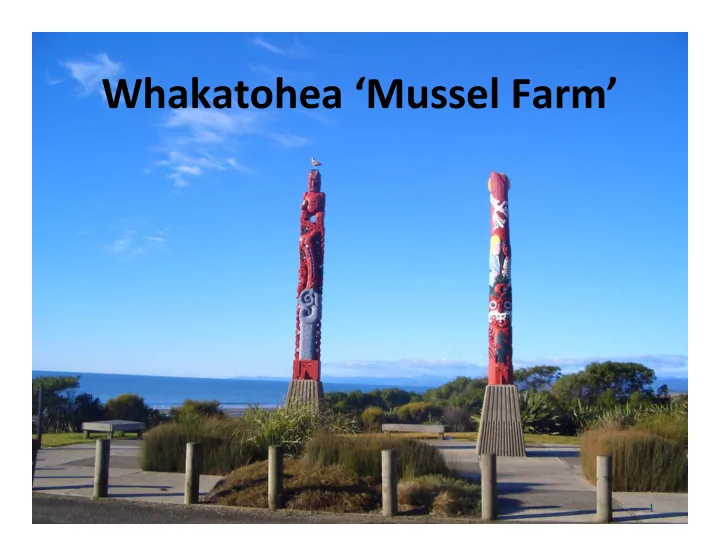

Whakatohea ‘Mussel Farm’ �
Eastern Seafarms Water space � 3,800 hectares � 40 meters depth / 8.5 kilometers off the coast of Opotiki � Ownership - Whakatohea 54% - Sealords 26% - NZ Seafarms 20% � Property rights - 20 yrs with the right of renewal � Consented to farm shellfish, sea cucumber, native seaweed �
Commercial trials � 3 year commercial trial / start October 2010 - anchoring systems - long line options - growth rates / condition - triploid mussels / oysters � Results to date; - good natural spat catch - growing well - little wear and tear structures �
Commercial trials – Monitoring � longlines are monitored every two weeks; - floatation / wear and tear / spat catch - growth rates / water quality � Ongoing testing; - longline backbone options - floatation (buoy) systems � The information received from this commercial trial will largely determine the viability of the project �
Monitoring data � Inputs that most influence the profitability of the farm Input variables Production meters per line Crop yield Spat purchase per meter Cycle length Price per tone � The commercial trials will determine the input variables used in the business plan �
Business Plan � Farming and processing of mussels only � Farm developed over 12 years � Hatchery required - triploid mussels � Processing factory - 6,000 tonnes � Diversify into other products to spread risk �
Mussel Spat Supply � Use natural spat first 4 years � Build a hatchery in Year 4 – triploid mussel � From Year 5 the farm would; - capture 50% spat from the farm - 50% triploid from the hatchery � Capture natural spat for sale to third parties �
Hatchery � In-house production of triploid mussels � Capability to breed; - oyster, scallop, goeduck - sea cucumber juveniles � Reduced reliance on the vagaries of natural spat supply � Supply to third parties �
Farming � Spat management; - ensure continuous supply for production lines � Crop management; - supply consistent product to the processing plant � Longline maintenance; - maintain the integrity of the equipment �
Farm Structures � Fully tested through the current trials � Similar to other open ocean sites � Coastal permit stipulates a staged development � Assumed change to the consent develop over 12 years � Ongoing monitoring from stage 1A ��
Mussel farm structure Diagrammatical ���� ���� ���� �������� ������ ������� ���� �������������������� ����� ��� ������������� ��
Vessels and Equipment � Owned and managed by the company � Harvest vessel (1) – year 1 - 30m long, 8m draft, draft 2.5m –100 tonne mussels � Spat seeding vessel (1) – year 4 - min 20 m long, 8m draft, draft 2.5m – seed 8 lines day � Farm servicing vessel (2) – year 8 & 11 - similar to the spat vessel /multi-task / dive tender ��
Port Facilities � Wharf owned by 3 rd party � Vessels turn around and maneuver in port � Wharf long enough for more than one mussel vessel � Mooring / berthing facilities for all mussel vessels (4 or 5) � Vessel cranes designed to offload / on-loading of product ��
Processing Plant � Located as close to the wharf as possible � Product offloaded at wharf, forklifted to coolstorage � Manual opening to produce half shell mussels � Viable mussel processing plant, 10,000 tonnes � Additional capacity added in 5,000 tonne modules ��
Packing Capacity Year of Operation Forecast GWT GWT Capacity Capacity % 8,804 10,000 88% 5 11,272 113% 6 11,809 15,000 79% 7 14,107 94% 8 16.675 111% 9 17,842 20,000 89% 10 18,976 95% 11 22,278 111% 12 24,678 25,000 99% 13 Note; # GWT = greenweight tonnes � Construction would start 1 year before processing starts ��
Potential Employment Year 1 2 3 4 5 6 7 8 9 10 11 12 Hatchery 4 5 6 7 7 7 7 7 7 7 7 7 On-water 10 10 20 20 20 30 30 30 30 40 40 40 Processing 192 288 288 288 384 384 384 480 Admin/Man 1 1 1 1 9 13 13 13 17 17 17 20 Total 15 16 27 28 228 338 338 338 438 448 448 547 Note; 1.FTE’s to operate the core business 2. Exclusive of necessary service industries ��
Summary � The commercial trial and market forecast will largely determine the viability of the project � Costs and revenues are currently being verified from the ground up using industry participants � If the Opotiki port construction does not go ahead then this venture would need complete reassessment to gauge its viability. ��
Mussel farm ��
Opotiki ��
Trial Work ��
Commercial Trial ��
Recommend
More recommend