Westfield Schools Additions & Renovations Teaching Stations By - - PowerPoint PPT Presentation

westfield schools additions renovations
SMART_READER_LITE
LIVE PREVIEW

Westfield Schools Additions & Renovations Teaching Stations By - - PowerPoint PPT Presentation

Westfield Schools Additions & Renovations Teaching Stations By Room Room Name/ Room Teaching Max. Term 1 Occupancy Term 2 Occupancy Term 3 Occupancy Utilization Floor Subject Subject Number Stations Enrollment Period 1 Period 2


slide-1
SLIDE 1

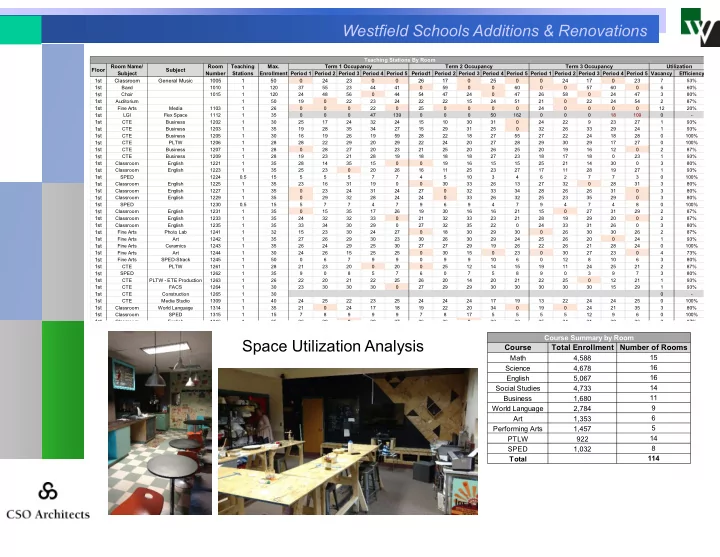
Westfield Schools Additions & Renovations Space Utilization Analysis

Period 1 Period 2 Period 3 Period 4 Period 5 Period1 Period 2 Period 3 Period 4 Period 5 Period 1 Period 2 Period 3 Period 4 Period 5 Vacancy Efficiency 1st Classroom General Music 1005 1 50 24 23 26 17 25 24 17 23 7 53% 1st Band 1010 1 120 37 55 23 44 41 59 60 57 60 6 60% 1st Choir 1015 1 120 24 48 56 44 54 47 24 47 26 58 24 47 3 80% 1st Auditorium 1 50 19 22 23 24 22 22 15 24 51 21 22 24 54 2 87% 1st Fine Arts Media 1103 1 26 22 25 24 12 20% 1st LGI Flex Space 1112 1 35 47 139 50 162 18 109

  • 1st

CTE Business 1202 1 30 25 17 24 32 24 15 10 30 31 24 22 9 23 27 1 93% 1st CTE Business 1203 1 35 19 28 35 34 27 15 29 31 25 32 26 33 29 24 1 93% 1st CTE Business 1205 1 30 16 19 26 19 59 28 22 18 27 55 27 22 24 18 28 100% 1st CTE PLTW 1206 1 28 28 22 29 20 29 22 24 20 27 28 29 30 29 17 27 100% 1st CTE Business 1207 1 28 28 27 20 23 21 25 20 26 25 20 19 16 12 2 87% 1st CTE Business 1209 1 28 19 23 21 28 19 18 18 18 27 23 18 17 18 23 1 93% 1st Classroom English 1221 1 35 28 14 35 15 19 16 15 15 25 21 14 30 3 80% 1st Classroom English 1223 1 35 25 23 20 26 16 11 25 23 27 17 11 28 19 27 1 93% 1st SPED 1224 0.5 15 5 5 5 7 7 4 5 10 3 4 6 2 7 7 3 100% 1st Classroom English 1225 1 35 23 16 31 19 30 33 26 13 27 32 28 31 3 80% 1st Classroom English 1227 1 35 23 24 31 24 27 32 33 34 28 26 26 31 3 80% 1st Classroom English 1229 1 35 29 32 28 24 24 33 26 32 25 23 35 29 3 80% 1st SPED 1230 0.5 15 5 7 7 4 7 9 6 9 4 7 9 4 7 4 8 100% 1st Classroom English 1231 1 35 15 35 17 26 19 30 16 16 21 15 27 31 29 2 87% 1st Classroom English 1233 1 35 24 32 32 33 21 32 33 23 21 28 19 29 20 2 87% 1st Classroom English 1235 1 35 33 34 30 29 27 32 35 22 24 33 31 26 3 80% 1st Fine Arts Photo Lab 1241 1 32 15 23 30 24 27 18 30 29 30 26 30 30 26 2 87% 1st Fine Arts Art 1242 1 35 27 26 29 30 23 30 26 30 29 24 25 26 20 24 1 93% 1st Fine Arts Ceramics 1243 1 35 26 24 29 25 30 27 27 29 19 26 22 26 21 28 24 100% 1st Fine Arts Art 1244 1 30 24 26 15 25 25 30 15 23 30 27 23 4 73% 1st Fine Arts SPED-Strack 1245 1 50 6 7 9 9 9 9 10 6 12 8 10 6 3 80% 1st CTE PLTW 1261 1 28 21 23 20 20 25 12 14 15 19 11 24 25 21 2 87% 1st SPED 1262 1 35 9 8 5 7 6 7 5 8 9 3 9 7 3 80% 1st CTE PLTW - ETE Production 1263 1 26 22 20 21 22 25 26 20 14 20 21 22 25 12 21 1 93% 1st CTE FACS 1264 1 30 23 30 30 30 27 29 29 30 30 30 30 30 15 29 1 93% 1st CTE Construction 1265 1 30

  • 1st

CTE Media Studio 1309 1 40 24 25 22 23 25 24 24 24 17 19 13 22 24 24 25 100% 1st Classroom World Language 1314 1 35 21 24 17 18 19 22 20 34 19 24 21 35 3 80% 1st Classroom SPED 1315 1 15 7 8 9 9 9 7 8 17 5 5 5 5 12 9 6 100% 1st Classroom English 1316 1 35 26 29 30 27 26 36 22 22 25 24 31 30 26 2 87% Term 2 Occupancy Term 3 Occupancy Utilization Teaching Stations By Room Floor Room Name/ Subject Subject Term 1 Occupancy Room Number Teaching Stations Max. Enrollment

Course Total Enrollment Number of Rooms

Math 4,588 15 Science 4,678 16 English 5,067 16 Social Studies 4,733 14 Business 1,680 11 World Language 2,784 9 Art 1,353 6 Performing Arts 1,457 5 PTLW 922 14 SPED 1,032 8 Total 114 Course Summary by Room

slide-2
SLIDE 2

Westfield Schools Additions & Renovations Capacity Summary

Current Teaching Stations Class Size Capacity Subtotal Efficiency Total Current Capacity Additional Teaching Stations Total New Capacity Empty Periods 110 27 2970 82% 2449 41 3362 3 of 15 110 27 2970 85% 2525 34 3305 2 of 15 110 27 2970 93% 2762 24 3365 1 of 15 New Spaces How Many Culinary Arts Kitchen 1 FACS Classroom 2 Innovation/Entrep. 2 PLTW 1 Const/Manuf 1 Science Classroom 6 Orchestra 1 Percussion 1 Music Classroom 1 Math 5 Social Studies 6 English 6 World Language 3 SPED 1 Total New Teaching Stations 37 Classrooms 34 (Ensemble)

Westfield HS Capacity Summary

(1) MIDI Lab (does not include lab) Notes (could be 1 if lab counted) Multiple screen room

slide-3
SLIDE 3

Westfield Schools Additions & Renovations Space Program Chart

SPACE SPACE SPACE count each total count each total count 1. General Classrooms* 54 788 42,577 67 854 57,218 13 Math 15 20 5 Social Studies 14 20 6 English 16 22 6 World Language 9 12 3 2. Small Group 1 120 120 17 214 3,638 16 3. Studio 14 1,113 15,579 14 4. Teacher Offices 5 285 1,425 6 700 4,200 1 5. Workrooms 2 217 433 2 217 433 6. Hallway Storage 7 146 1,024 7 146 1,024 Sub-Total: 45,579 82,092 36,513 1. General Classrooms 9 879 7,911 15 879 13,185 6 Innovation/Entrepreneurship 5 7 2 FACS 2 2 PLTW 3 4 1 Construction/Manufacturing 1 2 1 2. Construction/Manufacturing Lab 1 2,007 2,007 1 2,500 2,500 3. C/M Lab Storage 2 160 320 2 250 500 4. FACS Lab 1 1,201 1,201 1 1,201 1,201 1 5. Culinary Arts Kitchen 1 1,500 1,500 1 6. Culinary Arts Storage 2 200 400 1 7. CTE Storage/Workrooms 6 230 1,382 6 230 1,382 Sub-Total: 12,821 20,668 7,847 1. Computer Lab 3 873 2,618 3 873 2,618 2. Project/Distance Learning Lab 1 787 787 1 787 787 Sub-Total: 3,405 3,405 1. Science Combined Classroom/Lab 10 1,200 12,000 3 1,800 5,400 1 2. Science Classroom 4 790 3,160 16 900 14,400 12 3. Shared Science Lab 1 4,700 4,700 1 4. Science PREP/Storage 6 284 1,702 3 125 375

  • 3

5. Faculty Workroom 1 1,019 1,019 1 1,150 1,150 Sub-Total: 17,881 26,025 8,144 1. Special Ed. 9 742 6,682 11 742 8,162 2 2. Special Ed. Office 2 155 327 2 155 310 3. Special Ed. Conference Room 2 164 344 2 164 328 4. Special Ed. Toilet & Shower Room 3 56 168 3 56 168 Sub-Total: 7,521 8,968 1,480 1. Main Instruction Area 1 2,923 2,923 1 2,923 2,923 2. Storage 3 112 335 3 112 335 Sub-Total: 3,258 3,258 1. Student Toilets (BOYS) 8 242 1,936 10 247 2,474 2 2. Student Toilets (GIRLS) 8 245 1,959 10 256 2,567 2 3. Staff Toilets 8 115 923 8 115 923 Sub-Total: 4,818 5,964 1,146 95,283 150,380 55,130 NOTES: 1,500 400 180 11,240 4,700 Total Student Learning Spaces:

BUILDING SPACE PROGRAM

  • B. CTE CLASSROOMS

538 608 15,579 1,480 14,641 5,274

  • C. ACADEMIC COMPUTER LAB
  • D. SCIENCE

EXISTING SPACE PROVISIONS PROPOSED DESIGN SPACES DIFFERENCE NET SQUARE FEET SQUARE FEET NET SQUARE FEET

  • E. SPECIALTY ROOMS
  • F. LARGE GROUP INSTRUCTION (L.G.I.)

Grades 9-10-11-12 SPACE DESCRIPTION total

  • 6,600

131 3,518 493

  • 1,327

1 STUDENT LEARNING SPACES

  • A. CLASSROOMS AND SUPPORT

WESTFIELD HIGH SCHOOL

  • G. SUPPORT

PROJECT #: 17076

2,775 1. Band Room 1 2,632 2,632 1 4,000 4,000 2. Band Storage 2 200 400 1 500 500

  • 1

3. Band Uniform Storage 1 501 501 1 550 550 4. Band Office 2 250 500 2 5. Instrument Storage 2 517 1,034 1 1,100 1,100

  • 1

6. Percussion 1 1,200 1,200 1 7. Practice Rooms - Band 2 128 256 4 100 400 2 8. Orchestra 1 1,500 1,500 1 9. Orchestra Stg 1 250 250 1 10. Orchestra Office 1 250 250 1 11. Choir Room 1 1,354 1,354 1 2,500 2,500 12. Choir Office 1 238 238 1 250 250 13. Choir Storage 4 161 644 2 500 1,000

  • 2

14. Practice Rooms - Choir 2 100 200 1 15. Student Toilet (GIRLS) 1 138 138 1 138 138 16. Student Toilet (BOYS) 1 134 134 1 134 134 17. Music Instruction 1 726 726 2 750 1,500 1 Sub-Total: 8,057 15,972 7,915 1. Art Room 5 1,250 6,250 5 1,250 6,250 2. Art Storage 5 238 1,192 5 238 1,192 3. Kiln Room 1 487 487 1 487 487 4. Dark Room 1 173 173 1 173 173 Sub-Total: 8,102 8,102 1. Auditorium 1 6,997 6,997 1 6,997 6,997 2. Storage 7 316 2,524 7 316 2,524 3. Stage 1 1,896 1,896 1 1,896 1,896 4. Dressing Room 2 465 930 2 465 930 5. Dressing Room Toilets 2 80 160 2 80 160 6. Stage Prep 1 1,460 1,460 1 1,460 1,460 7. Office 2 130 260 2 130 260 8. Lobby 1 1,993 1,993 1 1,993 1,993 9. Kitchenette 1 346 346 1 346 346 10. Projection Booth 1 1,366 1,366 1 1,366 1,366 11. Mechanical Mezzanine 1 2,887 2,887 1 2,887 2,887 Sub-Total: 20,819 20,819 36,978 44,893 7,915 1. Central Mechanical Room 1 6,830 6,831 1 6,830 6,831 2. Mechanical Rooms 3 624 1,872 3 624 1,872 3. Elevators 4 44 199 4 44 199 4. Elevator Equipment Closet 4 67 269 4 67 269 5. Custodians Office 2

  • 278

2

  • 278

6. Custodian Break Room 1 119 119 1 119 119 7. Custodial Closets 14 73 1,025 14 73 1,025 8. IDF Closets 2

  • 192

2

  • 192

9. Communication Closets 2 280 282 2 280 282 Sub-Total: 11,067 11,067 1. Shipping and Receiving 2. Secured Staging/Storage 3

  • 529

3

  • 529

Sub-Total: 529 529 11,596 11,596 299,246 361,995 63,045 Total Building 1,500 250 66 1,200 200 500 250 49 356 Total Performing/Visual Art Spaces: 774

  • A. MECHANICAL AND CUSTODIAL
  • B. PROPERTY CONTROL

12 Total Facility Management Spaces: 1,146 144 1,368 100

6 PERFORMING AND VISUAL ARTS SPACES

  • A. MUSIC
  • B. ART
  • C. AUDITORIUM

7 FACILITY MANAGEMENT AND SUPPORT SPACES

SPACE SPACE SPACE count each total count each total count

BUILDING SPACE PROGRAM

EXISTING SPACE PROVISIONS PROPOSED DESIGN SPACES DIFFERENCE NET SQUARE FEET SQUARE FEET NET SQUARE FEET Grades 9-10-11-12 SPACE DESCRIPTION total

1 STUDENT LEARNING SPACES

WESTFIELD HIGH SCHOOL

PROJECT #: 17076