Typical 500 MW Coal Fired Plant Selective Catalytic Reduction (SCR) - - PDF document

typical 500 mw coal fired plant
SMART_READER_LITE
LIVE PREVIEW

Typical 500 MW Coal Fired Plant Selective Catalytic Reduction (SCR) - - PDF document

COAL GEN PRESENTATION Efficiency Improvements to the Existing Coal-Fueled Fleet August 12, 2010 Richard F. Storm The average pulverized coal units in America are about as old - as I have been involved as an adult engineer in this business


slide-1
SLIDE 1

1 COAL – GEN PRESENTATION Efficiency Improvements to the Existing Coal-Fueled Fleet August 12, 2010 Richard F. Storm The average pulverized coal units in America are about as old - as I have been involved as an adult engineer in this business – and that is over 40 years. Most of the existing coal fleet as Chris Nichols, Phil DiPietro ET al, have summarized in The NETL report prepared earlier this year, operate at an average efficiency of about 32.5% which is a heat rate of about 10,500 Btu’s/kWh. The coal fleet, although old, has been pretty well maintained up to the last couple of years, but we are seeing the impact of cuts in

  • perations and maintenance budgets and lack of investment in upgrades to more optimally maintain the

existing fleet. Due to the threats of New Source Review (NSR) and anti-coal political correctness of top management, some of the coal fleet is operated at very good efficiency and some is simply mediocre in

  • performance. The best, or top 5%, operate very good thermal efficiencies of about 37% efficiency and

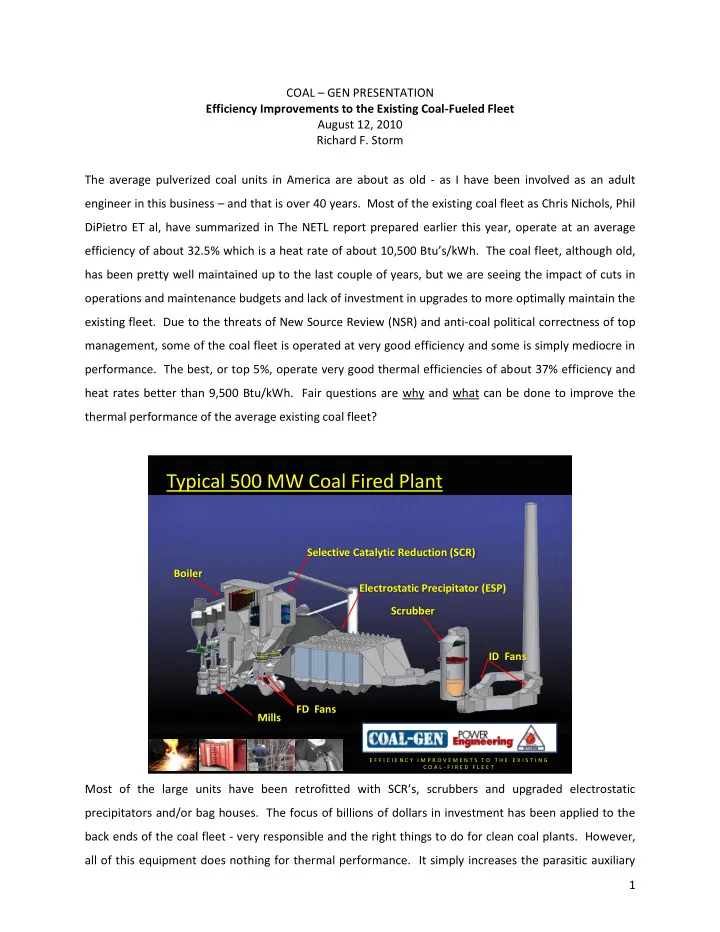
heat rates better than 9,500 Btu/kWh. Fair questions are why and what can be done to improve the thermal performance of the average existing coal fleet?

E F F I C I E N C Y I M P R O V E M E N T S T O T H E E X I S T I N G C O A L - F I R E D F L E E T

Typical 500 MW Coal Fired Plant

Electrostatic Precipitator (ESP) Selective Catalytic Reduction (SCR) Scrubber ID Fans Boiler FD Fans Mills

Most of the large units have been retrofitted with SCR’s, scrubbers and upgraded electrostatic precipitators and/or bag houses. The focus of billions of dollars in investment has been applied to the back ends of the coal fleet - very responsible and the right things to do for clean coal plants. However, all of this equipment does nothing for thermal performance. It simply increases the parasitic auxiliary

slide-2
SLIDE 2

2 power and in effect, reduces the net thermal efficiency of the plants. Let’s look at some of the most common opportunities to improve thermal performance:

E F F I C I E N C Y I M P R O V E M E N T S T O T H E E X I S T I N G C O A L - F I R E D F L E E T

Steam Cycle Losses High Primary Air Tempering Airflow High Carbon In Ash (LOI) Air In Leakage Reheat De-Superheating Spray Water Flows

Stealth Opportunities

We call these stealth losses or stealth opportunities. The five most common correctable losses are:

  • 1. Air in-leakage
  • 2. High furnace exit gas temperatures which causes high reheater, desuperheating spray water

flows.

  • 3. High primary airflows (especially harmful, is high tempering airflow that bypasses the airheaters)
  • 4. High carbon in ash
  • 5. Steam cycle losses

Other losses associated with a reducing atmosphere in the furnace are: slagging, fouling, increased soot-blowing, and increased fan power due to the fouling and plugging of the SH, SCR’s, APH. The increased negative pressure, as a result of fouling, therefore increases air in-leakage. The increased draft losses further exacerbate losses of ID fan capacity and wastes auxiliary power. The reducing atmosphere in the lower furnace, which is created by air in-leakage downstream of furnace exit, will also contribute to reliability problems such as water wall wastage.

slide-3
SLIDE 3

3

E F F I C I E N C Y I M P R O V E M E N T S T O T H E E X I S T I N G C O A L - F I R E D F L E E T

Air In-Leakage

  • Penalties due to air in-leakage (up to

300 Btu’s/kWh

  • PTC-4 does not take into account.

Thus, we call them “Stealth Losses”

  • In addition to the thermal penalty,

artificially high oxygen readings can have serious performance impacts

  • n good combustion
  • Leak path between penthouse and

air heater inlet gas

  • Bottom ash hopper seals
  • Air heater leakage and penalties

The number 1 problem in my experience, that is correctable, is air in-leakage of the convection pass. This stealth loss on 40+ year old boilers is almost a standard expectation for our test teams to find. Worse yet, if an ASME PTC 4.1 heat loss method efficiency test is run, the air in-leakage can be missed because the heat losses method of testing is based on calculating the efficiency losses per pound of as- fired fuel, based on flue gas chemistry and fuel analyses. All of the oxygen in the flue gas at the air heater inlet is “assumed” to have been admitted to the boiler through the burners. That is, when the heat loss method of calculating losses per pound of as-fired fuel is utilized.

slide-4
SLIDE 4

4

E F F I C I E N C Y I M P R O V E M E N T S T O T H E E X I S T I N G C O A L - F I R E D F L E E T

Tracking Oxygen in the Boiler

Furnace Exit: 2.56% Secondary APH 1 Inlet: 5.73% Secondary APH 2 Inlet: 5.88% Primary APH Inlet: 5.42% Secondary APH 1 Outlet: 7.15% Secondary APH 2 Outlet: 8.56% Primary APH Outlet: 11.68%

Location Leakage Additional KW’s Required Furnace Leakage (Avg)

19.37% 660

Secondary APH 1 Leakage

9.29% 21

Secondary APH 2 Leakage

19.51% 187

Primary APH Leakage

61.11% 432

I asked one of our engineers to look back on some past reports to get some actual numbers. This shows high leakage rates but really we have tested worse such as 600 mw units that have 35 year old Rothemuhle air heaters. Air heater leakage is mostly a fan power loss. But when the cold end of the air heater is maintained with additional heat from steam coil air heaters to keep the cold end above the acid dew point, then it becomes an efficiency loss equal to about 1% in efficiency for every 35oF of corrected to no leakage temperature at the APH exit. An approximation of unit heat rate penalty for air in-leakage of up to 20% equivalent ambient air, is over 300 Btu’s/kWh in heat rate penalty. Utility boilers built in the 1960’s and 1970’s were designed for zero air in-leakage and nearly no one ever expected the air in-leakage to reach double digit values.

slide-5
SLIDE 5

5

E F F I C I E N C Y I M P R O V E M E N T S T O T H E E X I S T I N G C O A L - F I R E D F L E E T

  • Obtain good reliable, representative flue gas analyses

and then calculate the X-ratio

  • Perform oxygen rise testing from furnace to ID fans
  • Monitor the stack CO2 or O2
  • Combine the intelligence and conditions found of

boiler inspections with test data, X-ratios and experience.

How Can You Identify Air In-Leakage?

How Can You Identify Air In-Leakage? Joe Nasal, Richard Des Jardins and their associates at General Physics have focused on monitoring “X”

  • ratios. This is the ratio of flue gas to combustion air of the air heaters, one good method of identifying

air in-leakage. However, representative and accurate instrumentation is required.

  • The method we employ most is oxygen rise testing from the furnace to the ID fans.
  • Monitor the stack CO2 or O2. In a perfect world of minimal leakage, the stack oxygen would be

about 4.5-5%. In the real world, stack oxygen is often over 8%.

  • Combine testing, operating data and internal inspections. Apply performance driven
  • maintenance. Often we see performance engineers and maintenance engineers in different

compartments or silos of responsibility, or mindset.

slide-6
SLIDE 6

6

E F F I C I E N C Y I M P R O V E M E N T S T O T H E E X I S T I N G C O A L - F I R E D F L E E T

Gross Costs Net Costs Design Superheater Spray Cost (2%) $120,088 Cost at 4% $240,177 $120,088 Cost at 6% $360,265 $240,177 Cost at 8% $480,353 $360,265 Cost at 10% $600,441 $480,353 Design Reheater Spray Cost (0%) $0 Cost at 5% $2,411,560 $2,411,560 Cost at 10% $4,823,120 $4,823,120

What Causes High Reheat Sprays?

What Causes High Reheat Sprays? Based on typical 500 MW unit

What about high RH sprays? What causes them? Basically 5 factors or a combination of these:

  • 1. Low NOX burners and secondary combustion
  • 2. Insufficient furnace oxygen
  • 3. Slagged furnace water walls
  • 4. Fuel changes from the original design fuel
  • 5. Non-optimized burner belt combustion

We have actually seen and tested non-optimal combustion, as illustrated in the slide above. Note the active flames entering the superheater. We have seen the difference between “optimized” (no flames in SH) and non-optimized (flame carryover into the SH) result in 1,000oF difference in flue gas temperatures with flame carryover. Truly, about 2,100oF with no flame carryover or 3,100oF with secondary combustion.

slide-7
SLIDE 7

7

E F F I C I E N C Y I M P R O V E M E N T S T O T H E E X I S T I N G C O A L - F I R E D F L E E T

  • Superheat sprays

miss the boiler and top level feedwater heaters

  • Reheater sprays

miss not only the boiler and top level feedwater heaters, but the high pressure stages of the turbine as well

Typical Spray Paths

Why is RH spray harmful to efficiency? The feedwater simply bypasses the top FW heaters and the high pressure turbine. The portion of steam evaporation in the reheater on a pro-rated basis is like a steam cycle at 700psi throttle pressure. It is like regressing into 1920’s power generation as Thomas Edison used steam in the early decades of the 20th century. Reheat sprays, with much higher than design flue gas temperatures, can create an opportunity to generate peak power. If the plant is boiler feed pump limited, then reheat sprays are a way to increase

  • utput by increasing steam mass flow through the IP and LP turbines. This is an inefficient method of

increasing turbine output.

slide-8
SLIDE 8

8

E F F I C I E N C Y I M P R O V E M E N T S T O T H E E X I S T I N G C O A L - F I R E D F L E E T

High Carbon in Ash

65% 84.3 % Flame Quench Zone Point at which the combustion should be completed Residence time

  • f 1-2 seconds

When flames carry over into the superheater, the tubes quench the flames causing the combustion of carbon to stop

High carbon in ash – basically – flame quenching in the SH and RH. It has consequences beyond the carbon losses (i.e. soot-blowing, cinders plugging SCR’s + APH’s, RH sprays, metals overheating).

E F F I C I E N C Y I M P R O V E M E N T S T O T H E E X I S T I N G C O A L - F I R E D F L E E T

  • Benefits of good LOI

– Improved heat rate – Indicative of “Optimum Combustion” (If LOI is good, so must combustion!) – Flyash utilization for concrete – Less sootblowing – Less cinders (popcorn ash to plug SCR and APH)

“Good Combustion” LOI

Good LOI: Heat rate, flyash utilization on concrete additive less sootblowing, less cycle losses, less cinders, less fouling.

slide-9
SLIDE 9

9

E F F I C I E N C Y I M P R O V E M E N T S T O T H E E X I S T I N G C O A L - F I R E D F L E E T

  • Example

– The worst measured LOI for a plant we have conducted business with was 35.88% – This was an efficiency penalty

  • f 4.71% (Higher than the dry

gas loss) – A simple classifier change brought the LOI and efficiency penalty down to 20.7% and 2.19% respectively.

High Carbon in Ash

Fuel Type Good Average Poor Eastern Bituminous < 5% 8% - 12% > 10% Western (Lignite / PRB) < 0.2% 0.2 – 0.7% > 1%

  • Typically only flyash LOI is measured,

but it is important to account for potentially high bottom ash LOI as well.

  • Bottom ash usually accounts for 5%

to 20% of the total chemical ash remaining.

High carbon in ash: good combustion w/PRB 0.1-0.2% LOI, good combustion bituminous 3-5% LOI. It is hard to get good in furnace combustion for low NOX and low LOI’s also.

E F F I C I E N C Y I M P R O V E M E N T S T O T H E E X I S T I N G C O A L - F I R E D F L E E T

  • Lower X-Ratios and gas side efficiencies are penalties of the

dry gas loss

  • Usually contributes to long flames, higher furnace NOx

production and increased slagging of the upper furnace

  • Wear is increased of coal piping and burner nozzles
  • Increased slagging, increased sootblowing to clean SH and RH

leads to increased cinder production which then creates air heater and SCR fouling, increased draft losses, increased fan power consumption and steam cycle losses for the increased soot blowing.

High Primary Air Flows and What it Means for Heat Rate

Good Average Poor Gas Side Efficiency > 62% 52% - 58% < 50%

slide-10
SLIDE 10

10

E F F I C I E N C Y I M P R O V E M E N T S T O T H E E X I S T I N G C O A L - F I R E D F L E E T

Another “Stealth Loss”

  • Steam Cycle Losses

– High Energy Drains. Valve leak-by – Feedwater Heater Emergency Drains – SH and RH high energy drains to blowdown tank or condenser should be checked regularly. Often 100+ Btu’s can be attributed to drain leakages. Especially Reheat drains to condenser

Cycle losses are real – high energy drains, valve leak-by

E F F I C I E N C Y I M P R O V E M E N T S T O T H E E X I S T I N G C O A L - F I R E D F L E E T

Steam Side Opportunity Example

  • Approximately 40MW oil

electric utility plant limited on load.

  • An emergency drain to

the condenser was found to be open. When closed, it resulted in an immediate load increase

  • f 3MW (Greater than

7% of total generation capacity!) Example: On a small island power generating facility, a high level emergency drain to the condenser was found open. This oversight resulted in a loss of over 3MW of the 40MW capacity and a significant heat rate penalty.

slide-11
SLIDE 11

11

E F F I C I E N C Y I M P R O V E M E N T S T O T H E E X I S T I N G C O A L - F I R E D F L E E T

How about NSR? Here are a few examples :

  • Fire Side-Steam Side Compatibility

is needed. Many units are not.

What are some impediments to do the right thing? As a consultant, I often look on, “as a fly on the wall”

  • f high level decision makers, as they commit hundreds of millions of dollars to stack clean up

apparatus, and deny a few million dollars that could improve the plant thermal performance. One rational reason for this as ridiculous as it seems, is the EPA and New Source Review. The same people who think that carbon endangers humanity are restricting improvements in thermal performance and the reductions in carbon dioxide by foolish and ill conceived laws. Not to mention that most large plants have SCR’s, sulfur scrubbers and basically most of the same stack flue gas clean up equipment as a new pulverized coal plant. Examples of some “good decisions that were not made” because of the NSR threat: Fire side steam side compatibility Add RH surface or S.H. surface New upgraded boiler feed pumps New air heaters to replace old and inefficient ones New and upgraded coal pulverizers for increased fineness and better fuel distribution New condensers and upgraded tubing New more efficient turbine rotors New and upgraded feedwater heaters

slide-12
SLIDE 12

12

E F F I C I E N C Y I M P R O V E M E N T S T O T H E E X I S T I N G C O A L - F I R E D F L E E T

22 Controllable Heat Rate Variables

  • 1. Flyash Loss On Ignition (LOI)
  • 2. Bottom ash carbon content
  • 3. Boiler and ductwrk air in-leakage
  • 4. More precise primary airflow measurement and control / Reduced tempering airflow

(which bypasses the airheaters)

  • 5. Reducing pulverizer air in-leakage on suction mills
  • 6. Pulverizer throat size and geometry optimization to reduce coal rejects and

compliment operation at lower primary airflows

  • 7. Secondary airflow measurement and control for more precise control of furnace

stoichiometry, especially important for low NOX operation

  • 8. Reduction of extremely high upper furnace exit (FEGT) peak temperatures, which

contribute to “Popcorn Ash” carryover to the SCR’s and APH’s, high spray flows, boiler slagging and fouling, and high draft losses due to fouling. The high draft losses cause increased in-leakage, increased fan auxiliary power wastage and increased associated losses with the high spray flows

  • 9. High de-superheating spray flow to the superheater
  • 10. High de-superheating spray flow to the reheater
  • 11. High air heater leakage (note: Ljungstrom regenerative airheaters should and can be

less than 9% leakage)

Operations and Maintenance Controllable Heat Rate Factors Here, in the slide above and the next slide, are 22 - controllable at the boiler through best practices of performance driven maintenance. Amongst the operations and maintenance controllable factors are: Air in-leakage Flyash LOI FEGT (Furnace Exit Gas Temperature) S.H. and R.H. Sprays 13 Essentials to burner belt First identify the problems and then correct them!

slide-13
SLIDE 13

13

E F F I C I E N C Y I M P R O V E M E N T S T O T H E E X I S T I N G C O A L - F I R E D F L E E T

22 Controllable Heat Rate Variables

  • 12. Auxiliary power consumption/optimization i.e., fan clearances, duct leakage, primary

air system optimization, etc.

  • 13. Superheater outlet temperature
  • 14. Reheater outlet temperature
  • 15. Airheater outlet temperature
  • 16. Airheater exit gas temperature, corrected to a “no leakage” basis, and brought to the
  • ptimum level
  • 17. Burner “inputs” tuning for lowest possible excess oxygen at the boiler outlet and

satisfactory NOX and LOI. Applying the “Thirteen Essentials”

  • 18. Boiler exit (economizer exit) gas temperatures ideally between 650°F to 750°F, with

zero air in-leakage (no dilution!)

  • 19. Cycle losses due to valve leak through – i.e. spray valves, reheater drains to the

condenser, superheater and re-heater drains and vents, and especially any low point drains to the condenser or to the hotwell

  • 20. “Soot blowing” Optimization – or smart soot blowing based on excellence in power

plant operation. (Remember, soot blowing medium is a heat rate cost, whether compressed air or steam)

  • 21. Feed water heater level controls and steam cycle attention to detail
  • 22. Steam purity and the costly impact of turbine deposits on heat rate and capacity

E F F I C I E N C Y I M P R O V E M E N T S T O T H E E X I S T I N G C O A L - F I R E D F L E E T

What can you do? Here are some suggestions:

  • Train the O&M Staff in the basics of what can be gained by

attention to small factors, such as airflow management, reducing air in-leakage and monitoring excess oxygen levels through the boiler and ductwork to the stack.

  • Combine Performance Testing with Maintenance Planning, we

call it “Performance Driven Maintenance”

  • Convince management to push back on foolish NSR rules, get

support from friends. NSR is a problem for improving efficiency of the fleet of old coal plants and serves no purpose anyway with most units that have been upgraded with stack clean up systems anyway.

What can you do?

  • 1. Train the O&M Staff
  • 2. Combine performance testing and maintenance planning, obvious but often overlooked, don’t

put performance & maintenance people in different silos

  • 3. Educate your friends and the public on the importance of coal for America’s future
slide-14
SLIDE 14

14

  • 4. Encourage your friends to write your congressmen and senators to push back on out of control

radical environmental anti-coal laws and rules

  • 5. Keep America strong – support Coal Power!

Thank you very much for your time and participation at this conference. I would like to acknowledge and say thank you to my associates who prepared the data and slides used for this presentation. The data is a result of nearly all of the Storm Technologies, Inc. team. The slides and data for this presentation were prepared by Nhia Ly and Stephen Hall. Richard F. (Dick) Storm, P.E. Storm Technologies, Inc. www.stormeng.com P 704-983-2040