Spatiotemporal Context in Analysis and Visualization of Movement - - PowerPoint PPT Presentation

spatiotemporal context in analysis and visualization of
SMART_READER_LITE
LIVE PREVIEW

Spatiotemporal Context in Analysis and Visualization of Movement - - PowerPoint PPT Presentation

Somayeh Dodge, AAG 2015 Introduction | Context | Analytics | Visualization | Final Remarks Spatiotemporal Context in Analysis and Visualization of Movement Somayeh Dodge Assistant Professor University of Colorado, Colorado Springs


slide-1
SLIDE 1

Spatiotemporal Context in Analysis and Visualization of Movement

Somayeh Dodge Assistant Professor University of Colorado, Colorado Springs sdodge3@uccs.edu Glenn Xavier (UCCS) Maike Buchin (Ruhr-University Bochum) Sean C Ahearn (Hunter College - CUNY)

Gain insights into the behavior of dynamic objects and spatiotemporal processes

Image courtesy of Sebastian Cruz

Introduction | Context | Analytics | Visualization | Final Remarks

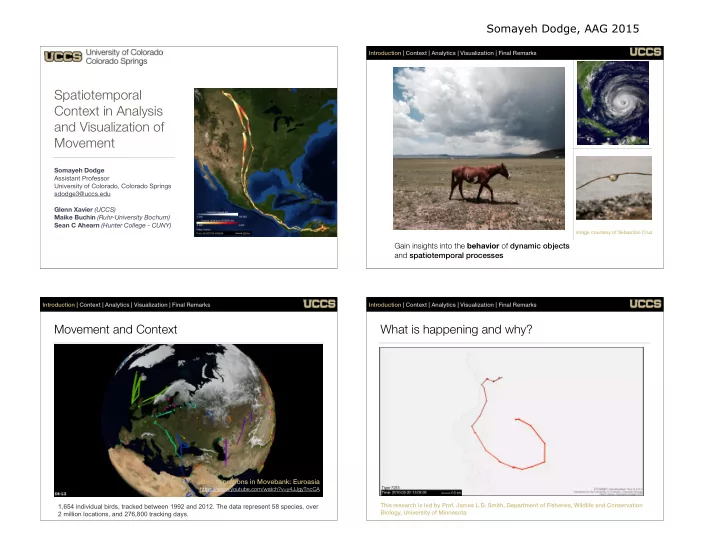
Movement and Context

Bird migrations in Movebank: Euroasia

https://www.youtube.com/watch?v=y4JJgyTncCA

1,654 individual birds, tracked between 1992 and 2012. The data represent 58 species, over 2 million locations, and 276,800 tracking days.

Introduction | Context | Analytics | Visualization | Final Remarks

What is happening and why?

This research is led by Prof. James L.D. Smith, Department of Fisheries, Wildlife and Conservation Biology, University of Minnesota Introduction | Context | Analytics | Visualization | Final Remarks

Somayeh Dodge, AAG 2015

slide-2
SLIDE 2

What is happening and why?

This research is led by Prof. James L.D. Smith, Department of Fisheries, Wildlife and Conservation Biology, University of Minnesota Introduction | Context | Analytics | Visualization | Final Remarks

extracting behavior movement analytics

From Observation to Behavior

Introduction | Context | Analytics | Visualization | Final Remarks

Geographic and dynamic visualization movement

  • bservation

relation to context

explore data & generate hypothesis visualize patterns explore relationships & correlations infer & interpret behavior

Spatiotemporal Context

๏ External factors that influence a dynamic process at a specific time scale ๏ Geography/Physiography ๏ Land cover ๏ Characteristics of terrain ๏ Network ๏ Obstacles (river, lake) ๏ Environment ๏ Ambient condition ๏ Weather ๏ Presence of other agents (interactions) ๏ Time ๏ Season ๏ Time of day ๏ Weekdays/weekends Introduction | Context | Analytics | Visualization | Final Remarks

Modeling Context

๏ Discrete ๏ Network ๏ Polygons ๏ Continuous ๏ raste grid Introduction | Context | Analytics | Visualization | Final Remarks

t

time

Somayeh Dodge, AAG 2015

slide-3
SLIDE 3

Movement Track Annotation

Introduction | Context | Analytics | Visualization | Final Remarks

interpolation in space and time

te

t i m e

๏ Attributing context information to each tracking location (in space and

time) along a movement path.

๏ Using spatiotemporal interpolation

t1 t2

Movement Track Annotation

๏ Env-DATA: The Environmental-Data Automated Track

Annotation

๏ to link animal tracking data to a diverse range of context

variables

๏ to examine relationships between animal movement and

environmental conditions

๏ 16 large global datasets (~2500 variables): NASA, NOAA,

USGS, NCEP/NCAR and ECMWF weather reanalysis datasets

Introduction | Context | Analytics | Visualization | Final Remarks

Source: Dodge, et. al. (2013), Movement Ecology More info at: https://www.movebank.org/node/6607

Analytics Visualization

Using annotated trajectories.

Trajectory Similarity with Context

Introduction | Context | Analytics | Visualization | Final Remarks

Trajectory T = <(p1,t1),…,(pn,tn)> C = <c1,…,cn>

for matched points (p,t,c) and (p’,t’,c’)

dist(p,p’) + α dist(c,c’)

C1 C2 C2 C3 p p’

Buchin, M., Dodge, S., Speckmann, B. (2014). JOSIS ๏ integrate context & spatial similarity

Somayeh Dodge, AAG 2015

slide-4
SLIDE 4

Trajectory Similarity with Context

๏ dissimilarity is computed as the

weighted sum of spatial and context distance


๏ spatial distance: ๏ context distance: ๏ context weight:

Introduction | Context | Analytics | Visualization | Final Remarks

for matched points (p,t,c) and (p’,t’,c

dist(p,p’) + α dist(c,c’)

Buchin, M., Dodge, S., Speckmann, B. (2014). JOSIS

C1

C2 C2 C3 p p’

for matched poin

dist(p,p’) +

nts (p,t,c) and (p’,t’,c

+ α dist(c,c’)

points (p,t,c

’) + α d Trajectory Similarity with Context

๏ dissimilarity is computed as the

weighted sum of spatial and context distance


๏ spatial distance: Fréchet distance

Introduction | Context | Analytics | Visualization | Final Remarks

Buchin, M., Dodge, S., Speckmann, B. (2014). JOSIS

Fréchet for matched poin

dist(p,p’) +

for matched points (p,t,c) and (p’,t’,c

dist(p,p’) + α dist(c,c’) Context Distance

water grass forest grass C2 C1 C4 C3 Distance matrix: dual graph C1 C2 C3 C4 C1 c1 c1 c3 C2 c1 c∗ c2 C3 c1 c∗ c2 C4 c3 c2 c2 where c1 = c(forest, grass), c2 = c(grass, water), c3 = c(forest, water) and c∗ = min(c1 + c3, c2 + c4)

Source: Buchin, M., Dodge, S., Speckmann, B. (2014). JOSIS ๏ Shortest path on graph ๏ unit cost ๏ cost depending on the labels

Galapagos Albatross (Phoebastria irrorata)

Image courtesy of Sebastian Cruz

Tracking data: ๏ 9 adult albatrosses ๏ Breeding season (Jun to Sep 2008) ๏ Temporal resolution 90 minutes

Introduction | Context | Analytics | Visualization | Final Remarks

slide-5
SLIDE 5

Env-DATA Annotation

๏ Wind speed (m/s) and wind direction (degrees from North) ๏ Source: the NCEP Reanalysis 2 ๏ 6-hour, 2.5°, U/V-wind components ๏ http://www.esrl.noaa.gov/

Image courtesy of Sebastian Cruz

Introduction | Context | Analytics | Visualization | Final Remarks

Wind Flow Assistance

Longitude Latitude Duration (days)

Galapagos Island 20 40 60 80

  • 90
  • 88
  • 86
  • 84
  • 82
  • 80
  • 78 0 -2 -4 -6
  • 8
  • 10
  • 12

tail-wind (m/s)

  • 5

5 10

Space-time path representation

2D path representation Source: Dodge, et. al. (2013), Movement Ecology

Peru Introduction | Context | Analytics | Visualization | Final Remarks

Track Similarity

Source: Buchin, M., Dodge, S., Speckmann, B. (2014). JOSIS

Track Similarity

Source: Buchin, M., Dodge, S., Speckmann, B. (2014). JOSIS

slide-6
SLIDE 6

DYNAMO: Dynamic Visualization of Animal Movement and the Environment

Source: Xavier, Dodge (2014), MapInteract Proceedings

Introduction | Context | Analytics | Visualization | Final Remarks

Multivariate Visualization of Movement

๏ Visual variables ๏ line/point width, color ๏ vector size and direction

Source: Xavier, Dodge (2014), MapInteract Proceedings

Introduction | Context | Analytics | Visualization | Final Remarks

Method 1 (movement speed and wind speed) Dynamic Multivariate Visualization of Movement

Source: Dodge, et. al. (2013), Movement Ecology Xavier, Dodge (2014), MapInteract Proceedings Introduction | Context | Analytics | Visualization | Final Remarks

Method 2 (movement speed and wind direction/speed) Dynamic Multivariate Visualization of Movement

Source: Dodge, et. al. (2013), Movement Ecology Xavier, Dodge (2014), MapInteract Proceedings Introduction | Context | Analytics | Visualization | Final Remarks

slide-7
SLIDE 7

Shadowing Effect (spatiotemporal footprint)

Introduction | Context | Analytics | Visualization | Final Remarks

The importance of context in movement research

๏ Extracting behavior from

  • bservations

๏ Interpreting and

understanding movement patterns

๏ Study the impacts of

environmental change on behavior

Introduction | Context | Analytics | Visualization | Final Remarks Introduction | Context | Analytics | Visualization | Final Remarks

Bird migrations in Movebank: Euroasia https://www.youtube.com/watch?v=y4JJgyTncCA

Thank you!

๏ UCCS LAS Faculty-Student research award ๏ Tiger Research

James L.D. Smith, (University of Minnesota)

Achara Simcharoen (Conservation Ecology Program, King Mongkut’s University of Technology, Thailand )

๏ Movebank Env-DATA Project

Gil Bohrer (Env-DATA Project PI, The Ohio State University)

Max Planck Institute for Ornithology : Rolf Weinzierl (system admin), Sarah Davidson (data curator), Martin Wikelski (Movebank PI), Sebastian Cruz (Albatross data)