
SLIDE 1
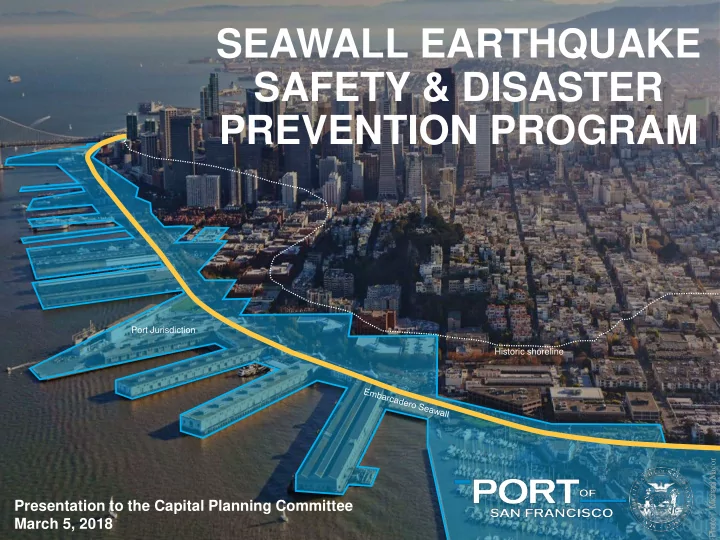
SEAWALL EARTHQUAKE SAFETY & DISASTER PREVENTION PROGRAM
Photo | Michael M acor Historic shoreline Port Jurisdiction
Presentation to the Capital Planning Committee March 5, 2018
SEAWALL EARTHQUAKE SAFETY & DISASTER PREVENTION PROGRAM Port - - PowerPoint PPT Presentation
SEAWALL EARTHQUAKE SAFETY & DISASTER PREVENTION PROGRAM Port Jurisdiction Historic shoreline acor Photo | Michael M Presentation to the Capital Planning Committee March 5, 2018 SEAWALL EARTHQUAKE SAFETY PROGRAM ESTIMATED $2-5 BILLION
Photo | Michael M acor Historic shoreline Port Jurisdiction
Presentation to the Capital Planning Committee March 5, 2018
2
San Francisco Seawall and Waterfront Protection Measure To protect San Francisco’s waterfront, BART and Muni tunnels, buildings, historic piers, and roads from earthquakes, flooding and rising sea levels by:
Seawall,
provide water and power to residents and businesses, shall the City of San Francisco issue $350 / $500 million in bonds, subject to independent citizen oversight and regular audits, with no increase in tax rates?
37% 30% 8% 2% 5%
14% 75%
3
Seawall identified as one of the City’s Top 5 most critical lifeline safety assets. Seismic and sea level rise vulnerabilities identified for further multi- hazard risk assessment to inform investment prioritization.
April 2014 June 2012
City sea level rise modeling identifies near-term flood risk, and maps rising tide and storm surge scenarios for years 2050 and 2100.
March 2016
Mayor’s Sea Level Rise Action Plan
November 2016
Army of Corps of Engineering issues federal interest determination under its flood hazard mitigation authority.
November 2017
Port’s Seawall Planning, Engineering, and Construction Project Commences Planning
July 2016
Seawall is found vulnerable to seismic
emergency response and lifeline assets.
4 Sea Level Rise Inundation Analysis Lifelines Council Interdependency Study
San Francisco establishes aggressive agenda for further sea level rise analysis, adaptation planning, and implementation.
Seawall Earthquake Vulnerability Study Federal Interest Determination
Port launches Seawall Earthquake Safety and Disaster Prevention Program.
Photo | Michael Macor
5
6
7 7
8
Program Development/ Planning, $14m
9
Data Collection & Field Investigations Multi-Hazard Risk Assessment
2020 2021 2022 2023 2024 2025 2026 2019 2018
Alternatives Development & Analysis Preliminary Design & Environmental Approvals, Phase I Projects, $25m Selection of Phase 1 Projects Development of Overall Program Design & Engineering to 35% NEPA & CEQA Solicitation of Contractors (DBB, DB, CMGC) Program Management Stakeholder Engagement Final Design & Construction, Phase I Projects, $385m Permits Construction & CM Closeout USACE CAP 103 (Near Term Flood Protection Project), $6m Feasibility Study Design & Construction Project Partnership Agreement Life Safety and Pilot Projects, $75m Critical life safety projects Final Design & Engineering
9
10
10
$- $100 $200 $300 $400 $500 $600 $- $20 $40 $60 $80 $100 $120 2018 2019 2020 2021 2022 2023 2024 2025 2026
CUMULATIVE EXPENDITURES ($M) ANNUAL EXPENDITURE ($M)
Planning Preliminary Design & Environmental Approvals USACE CAP 103 (35% Local Match) Life Safety and Pilot Projects Phase 1 Final Design & Construction Cumulative Total
72% PROBABILITY for a quake of at least 6.7 or GREATER magnitude to
11
Current Condition SLR Risk
12
13
14
RAISE/EXPAND LANDSCAPE EDGE
15
Photo | Michael Macor
25% 25% 35% 35% 25% 25% 15% 15%
16
Photo | Michael M acor
17