
SLIDE 1
Seawall Finance Work Group Draft Report Update to the Capital - - PowerPoint PPT Presentation
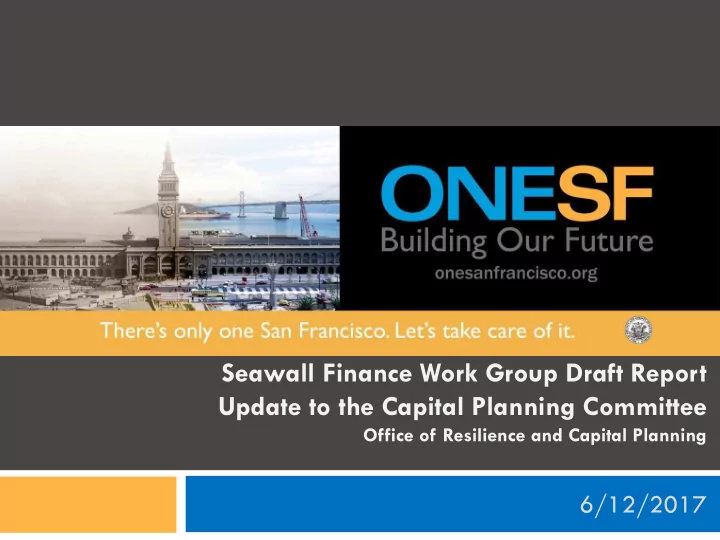
Seawall Finance Work Group Draft Report Update to the Capital Planning Committee Office of Resilience and Capital Planning 6/12/2017 Seawall Finance Work Group (SFWG) Overview 2 Mission: Analyze and prioritize the funding need Seawall
Mission: Analyze and prioritize
Part of San Francisco’s
Draft recommendations and
2
3
Chair: Office of Resilience and
Board of Supervisors City Administrator’s Office –
Controller’s Office – Office of
Mayor’s Office Office of Economic and
Port of San Francisco SFMTA Private sector financial expert
4
Supports historic piers, wharves, and buildings Underpins major tourist destinations on the waterfront Serves as a critical emergency response and recovery
5
Supports BART, Muni,
Provides flood protection
Phase I Overview $500 million 11 years January 2015 December 2025
Vulnerability Study $1.0 million 1.5 years January 2015 June 2016 Planning $8.5 million 2.5 years July 2016 December 2018 Preliminary Design & Environmental Approvals $25.5 million 2.0 years January 2019 December 2020 Final Design & Construction $465.0 million 5 years January 2021 December 2025
Phase II Overview ~ $5 billion ~ 20 years January 2026 January 2046
6
Port staff have envisioned 2 major phases to the Project:
Phase I – seismic improvements to address the most critical life safety
Phase II – potential replacement of the entire 3 miles of the Seawall
Note: Project cost estimates are in 2016 dollars and do not take into account the time value of money. It is important to consider the influence inflation will have on the overall cost of repairing the Seawall over time.
$500 Million Immediate Investment <10-years
Address life-safety & flood risks Long-term ~$5 billion need for seismic and sea level rise adaptation
$355 Million Planned/Proposed Funding
$4.0 million City Revolving Fund (to be reimbursed from Bond) $4.9 million Port ($2.9M), MTA ($1.0M), and Planning ($1.0M)
$350 million G.O. Bond Measure in the proposed Capital Plan (assuming
The SFWG will recommend sources to address remaining $145
7
8
FY16-17 FY17-18 FY18-19 FY19-20 FY20-21 FY21-22 FY23-26 Total
Funding Sources Port Capital
$2.9 $2.9
City Revolving Fund
$1.0 $3.0
$0.0
MTA Contribution
$0.5 $0.5 $1.0
Planning Department Contribution
$0.5 $0.3 $0.3 $1.0
2018 General Obligation Bond
$6.7 $7.2 $18.6 $19.7 $297.8 $350.0
Total Planned Sources
$4.9 $3.8 $3.0 $7.2 $18.6 $19.7 $297.8 $354.9
Uses of Funds Project Staffing
$0.6 $0.9 $0.9 $0.9 $0.9 $1.0 $4.8 $10.0 Public Outreach $1.0 $0.6 $0.4 $2.0
Planning
$5.3 $2.4 $7.7
Preliminary Design/Entitlements
$5.8 $7.9 $3.9 $17.6
Final Design & Engineering
$5.0 $10.1 $28.6 $43.7
Construction
$4.8 $4.8 $409.5 $419.0
Total Estimated Uses
$0.6 $7.2 $3.9 $7.2 $18.6 $19.7 $442.9 $500.0
Cumulative Balance
$4.3 $0.9 $0.0 $0.0 $0.0 $0.0
10 meetings between November 2016 and May 2017 Work to date:
9
The SFWG analyzed 48 local, regional, state, and federal
10
State Resilience G.O. Bond
State Share of Property Tax Increment
Incorporate into Pier Rehab Projects
Geologic Hazard Abatement Districts (GHADs)
Surcharge on Event Tickets
Transit Pass Transfer Fee
Increase Ferry Charges
Cruise Ticket Surcharge
Hazard Mitigation Grants
National Foundation Grants
Historic Tax Credits
Federal Transportation Funding
Army Corps of Engineers (USACE) – General Investigation
USACE – CAP 103 Program
DHS Office of Infrastructure Protection
Commuter Transportation Tax
Vehicle License Fee Increase
Tax/Fee on Auto Sales
Tax/Fee on Marina Uses
Transit Impact Development Fee
Increased Parking Revenues
G.O. Bonds
Assessment District
CFD/Mello-Roos
Port IFD
IRFDs
Sale/Lease Increment of Port Assets
Insurance Value Capture/Resilience Bonds
Sales Tax Increase
Parcel Tax
Real Estate Transfer Tax Increase
Utility User Tax Surcharge
Business License Tax Surcharge
RM3- Bridge Tolls
Cap & Trade Program Funding
Regional Gas Tax
Congestion Pricing
Tax/Fee on Rental Cars
Business Gross Receipts Tax Surcharge
Hotel Assessment
Infrastructure Trust Bank
Green/Climate Bonds
Environmental Impact Bonds
Advertising
Naming Rights
Public Private Partnerships
Philanthropy
Pension Plan Investment
11
Rank Funding Strategy Source of Funds Revenue Generating Potential *** Cost of Funds Long Term Sustainability Flexibility of Funds Timing Tradeoffs for Other City Needs State/Federal Political Feasability Local/Regional Political Feasability Administrative Complexity Equity/Cost Burden Weighted Average 1 Local Property Tax Increment from IFDs 5 5 5 4 5 5 4 5 5 4 5 4.77 2 Community Facilities District (CFD) 5 5 5 5 5 3 4 5 3 3 5 4.46 3 USACE – CAP 103 Program 5 5 4 3 3 5 5 4 5 3 5 4.38 4 State Property Tax Increment from IFDs 5 5 3 5 5 3 4 3 5 3 5 4.31 5 General Obligation (G.O.) Bonds 5 5 5 5 3 3 2 5 3 5 4 4.23 6 Cap & Trade Program Funding 5 5 5 3 3 5 3 3 3 5 5 4.23 7 State Resilience G.O. Bond 5 5 5 5 3 3 4 3 3 4 5 4.23 8 Sales Tax Increase 5 5 5 5 5 3 1 5 2 5 3 4.15 9 Hotel Assessment 5 5 4 3 5 3 2 5 2 4 5 4.08 10 Increased Parking Revenues 5 5 5 3 3 3 2 5 1 5 5 4.00 11 Assessment District 5 5 5 5 5 3 3 4 1 1 5 4.00 12 USACE – General Investigation 5 5 5 5 3 1 3 3 3 2 5 3.85 13 Philanthropy 5 2 5 2 5 2 4 5 5 5 5 3.77 14 Historic Tax Credits 5 3 5 2 1 3 5 5 5 4 5 3.77 15 Tax/Fee on Marina Uses 5 1 5 5 5 5 3 5 1 5 5 3.62 16 Cruise Tickets Surcharge Increase 5 1 3 5 5 3 5 5 4 4 4 3.54 17 Advertising 5 1 2 3 5 5 5 5 2 5 5 3.46 18 RM3- Bridge Tolls Program 5 5 5 5 3 2 1 1 2 3 3 3.46 19 Vehicle License Fee (VLF) Increase 5 3 3 2 5 3 1 5 1 5 5 3.38 20 Parcel Tax 5 3 5 2 5 3 2 5 2 5 1 3.38 21 Naming Rights 5 1 5 2 5 4 4 5 2 3 5 3.31 22 Congestion Pricing 5 5 3 5 3 2 2 2 1 1 2 3.15 23 Public Private Partnerships (P3s) 1 4 1 3 5 3 5 4 1 3 2 3.08 24 Utility User Tax Surcharge 5 3 2 3 5 2 1 3 1 4 3 2.92 25 Transit Impact Development Fee 5 1 1 3 2 5 1 5 2 4 5 2.77 26 Federal Transportation Funding - TIFIA 3 4 3 3 3 1 2 1 3 1 4 2.77 27 Real Estate Transfer Tax Increase 3 3 3 3 3 3 1 5 1 1 3 2.69 28 Surcharge on Event Tickets 4 1 1 3 4 3 2 5 1 5 3 2.62 29 Environmental Impact Bonds 5 1 3 2 4 2 2 5 2 2 4 2.62 30 Sale/Lease Increment of Port Assets 2 2 3 4 5 2 1 1 1 5 4 2.62 31 Regional Gas Tax 3 4 1 1 3 2 1 2 1 3 3 2.46 32 Increased Ferry Charges 5 1 1 2 4 2 3 2 1 4 3 2.31 33 Hazard Mitigation Grants 5 1 3 1 1 1 3 1 3 4 5 2.31 34 Pension Plan Investment 2 3 3 1 4 1 2 1 2 2 3 2.31 35 Geologic Hazard Abatement Districts 3 1 1 3 4 1 4 3 1 1 5 2.23 36 Infrastructure Trust Bank 4 2 1 1 3 2 2 1 1 1 4 2.00 37 Transit Pass Transfer Fee 1 1 1 1 1 1 1 1 1 1 1 1.00 38 Resilience Bonds/Insurance Value Capture 1 1 1 1 1 1 1 1 1 1 1 1.00
5 Strength 5 4 Partial strength 4 3 Neither strength nor weakness 3 2 Partial weakness 2 1 Weakness 1 *** Criteria Triple Weighted Key:
12
5 Considerations:
13
SFWG created 3 sets of recommendations:
Funding
Increase Revenue
Revenue
Historic Tax Credits
Partnerships (P3s)
Program Funding
Recommendation: Pursue the $350 million G.O. Bond proposed
14
cost in comparison to other public finance tools
established in the City
Phase I
paying for an important City asset
capacity
City has a history of successfully passing G.O. Bonds
Next Steps: Pre-bond planning, public outreach campaign,
Recommendation: Create a CFD to fund sea-level rise
15
Next Steps: Economic analysis, administrative planning, and
potential
long-lasting aspects of Phase II
businesses closer to the waterfront benefit more than the average resident from a fortified Seawall
registered voters in the district
Recommendation: Use funds from IFDs over new development
16
dedicate funds already exists
a few years
lease holders would be paying for a project that directly impacts their property
Port already depends on IFD funds to pay for other capital needs
Next Steps: Board legislation
Recommendation: Pursue State legislation to obtain the State
17
next 5 years
regional and State asset – State should contribute funds
from State Legislature and Governor’s Office – however there is State precedent
Next Steps: Engage State stakeholders to build support,
Recommendation: Secure funding through State G.O. Bonds –
18
bonds could lead to $50- 150 million in funding
the next 5 years
regional and State asset – State should contribute funds
from State Legislature and Governor’s Office
Next Steps: Engage State stakeholders to build support for
Recommendation: Pursue General Investigation funding as well
19
cost, $1-3 billion – 1/3 local match needed
for Phase II
uncertain Congressional process to secure funding
funds available and construction begins
Next Steps: Proceed with CAP 103 Program, conduct a
Recommendation: Port should continue to dedicate funds and
20
million to date
million over the next 10 years
responsible for maintaining the waterfront and the Seawall
case of Seawall failure
funding need of this Project alone
deferred maintenance in the 10-Year Capital Plan
Next Steps: Port to explore ways to prioritize the Seawall
Recommendation: City should explore a Sales Tax increase and
21
source of revenue in the City
visitors – important users of the Seawall
Next Steps: Political and public outreach
Recommendation: Create a hotel assessment or an increased
22
potential
last for ~30 years
from tourists – important users of the Seawall
public (TOT)
administratively complex
Next Steps: Economic analysis and political and public
Low revenue potential or political feasibility but are related to
23
24
Thoughts on the recommended funding sources? How do we strategize and/or prioritize our recommendations? What other stakeholders should be engaged in this process? Other feedback?
25
26