
SLIDE 1
Justin Huntington, PhD
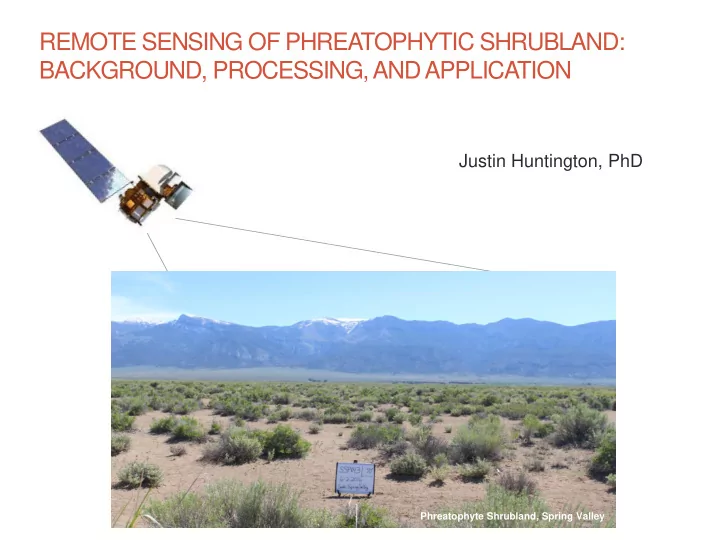
REMOTE SENSING OF PHREATOPHYTIC SHRUBLAND: BACKGROUND, PROCESSING, AND APPLICATION
Phreatophyte Shrubland, Spring Valley
REMOTE SENSING OF PHREATOPHYTIC SHRUBLAND: BACKGROUND, PROCESSING, - - PowerPoint PPT Presentation
REMOTE SENSING OF PHREATOPHYTIC SHRUBLAND: BACKGROUND, PROCESSING, AND APPLICATION Justin Huntington, PhD Phreatophyte Shrubland, Spring Valley Outline Introduction Motivation and background on satellite remote sensing of vegetation
Justin Huntington, PhD
Phreatophyte Shrubland, Spring Valley
Phreatophytic Shrubland, Spring Valley
“bands”
electromagnetic spectrum (e.g. blue and red)
properties of vegetation
NDVI = (NIR – Red) / (NIR + Red)
physicsopenlab.org
NDVI = (NIR – Red) / (NIR + Red)
NIR Red 50% 8% 40% 30% NIR Red
(0.50 – 0.08) / (0.50 + 0.08) = 0.72 (0.40 – 0.30) / (0.40 + 0.30) = 0.14
makers make wise decisions about our resources and our environment
vegetation change focus on the use of the Landsat 5, 7, and 8 archives (1984 to pres.)
also be used for vegetation monitoring
Landsat 8
Landsat 8
high resolution (i.e. 30m pixels)
resource management scales (i.e. field scale)
lack of data are reduced Landsat MODIS 30m 500m
“Given the more than 30-year record of Landsat data, mapping land and vegetation cover change is becoming common place.” -- 2004
spectrum
Plus (ETM+) (1999 – present), and when Landsat 7 is combined with Landsat 8 Optical Land Imager (OLI) (2013 – present).
Landsat paths, which is the case for the majority of Spring Valley shrubland areas analyzed.
Landsat 8
and row, or “scenes”
and rows (39:32, 39:33, 40:32, 40:33)
since 1985
process for Spring Valley
to 2009 ($600/image)
and in Google and Amazon clouds
an ideal satellite platform for monitoring vegetation over long time histories
Vegetation Index (SAVI), Modified Soil Adjusted Vegetation Index (MSAVI)
evapotranspiration (Nichols, 2000; Devitt et al., 2011; Beamer et al., 2013; Garcia et al., 2015), and groundwater dependent ecosystem conditions over time (Huntington et al., 2016; Carroll et al., 2017)
reasons:
1999; Wu 2014)
common indices in Spring Valley (Devitt et al., 2011)
and calibration factors developed and applied in the Great Basin (Huntington et al., 2016)
across research and practitioner communities
and is an appropriate method for monitoring shrubland habitat in the Great Basin
General Approach:
1)
Define analysis areas
2)
Derive time series of Landsat NDVI from 1985-2015
minimize the signal from vegetation that can be highly variable due to seasonal precipitation, and maximize the relevant signal for tracking annual changes in vegetation in relation to groundwater availability
3)
Derive time series of gridded weather data: water year precipitation (PPT) from 1985-2015
4)
Develop useful graphical and statistical characterizations of baseline conditions for understanding temporal and spatial relationships between vegetation cover and climate, hydrology, and management
1985 2016 Late Summer NDVI Water Year PPT
NDVI generally track well over time
precipitation (“PPT”) and summer average NDVI are likely antecedent soil moisture conditions, and shallow groundwater stabilizing minimum vegetation vigor and NDVI
baseline variability of vegetation and climate to be established at local to regional scales
NDVI; Black = High, White = Low
irrigation
anomalously high annual PPT
95% confidence level
groundwater levels
NDVI; Black = High, White = Low
grazing, and development of livestock water sources away from stream areas
late 1990s and early 2000s, NDVI never fell below pre-restoration values
Maggie Creek Susie Creek
NDVI; Black = High, White = Low
shrubland habitat vegetation for the purpose of establishing baseline conditions and conducting long-term monitoring its Spring Valley monitoring, management, and mitigation (3M) program
calibrated at-surface reflectance NDVI datasets, and gridMET PPT datasets from 1985-2015 were provided to SNWA for the Spring Valley Hydrographic Area
attenuation and scattering of light by the atmosphere between the satellite sensor and the land surface, and is required to compute at-surface reflectance
atmospheric correction
NASA) to calculate perceptible water in the atmosphere according to Tasumi et al. (2008)
atmospheric correction products in Nevada (Huntington et al, 2016)
across the different Landsat sensors (mainly the NIR band) corrections should be applied for long time series analysis using multiple Landsat sensors
bands for NDVI (red and NIR bands) was assessed and corrected for using Mojave and Great Basin images from Landsat 8 and 7 that were acquired within 7 min of each other on March 29, 2013 during the “under-fly” testing of the Landsat 8 system Huntington et al. (2016) Remote Sensing of Environment
Landsat Image from 1985-2015
cloud cover
NDVI values due to cloud cover
True Color Composite FMASK White = Cloud Black = Shadow Blue = Clear Cloud Score White -> Black Cloud -> Clear
computed for every available Landsat image from 1985-2015, clipped to the Spring Valley Hydrographic Area
Valley HA, and data extraction was performed using Google’s Earth Engine cloud computing platform
cloud mask/score data for the Landsat archive (1985-2015) was provided to SNWA
Independent Slopes Model (PRISM) (Daly et al., 1994) and NLDAS (Mitchell et al., 2004)
independent valley floor PPT measurements in Spring and Snake valleys, Nevada (McEvoy et al., 2014)
developed and provided to SNWA for the purpose of producing NDVI and PPT zonal statistics for analysis areas
zonal statistic procedures correctly to produce spatially averaged NDVI and PPT datasets for analysis
score datasets appropriately to omit cloud cover data
baseline conditions and conduct long-term monitoring
monitoring vegetation, and is commonly used as a proxy for vegetation cover
precipitation, for the Spring Valley HA from 1985-2015
SNWA and used appropriately
accepted standards