
SLIDE 1
1
Process Flows and Supporting Facility
1
Process Flow Structures Process Performance Facility Layout Servicescapes
Shin‐Ming Guo NKFUST
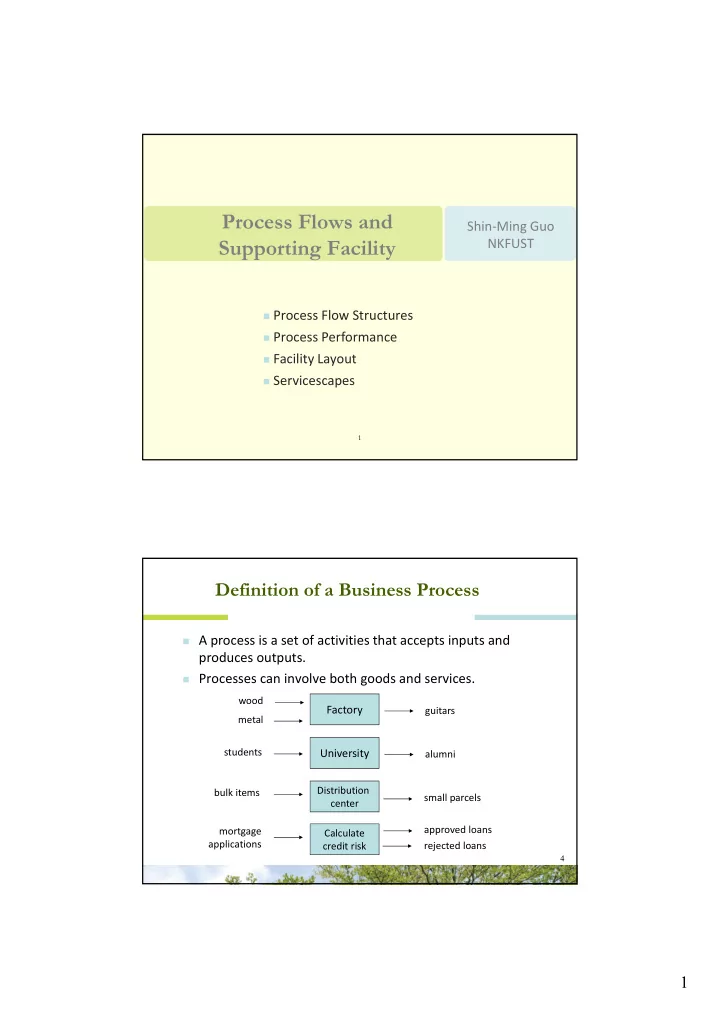
Definition of a Business Process
4
Factory
wood metal guitars
University
students alumni Distribution center bulk items small parcels Calculate credit risk mortgage applications approved loans rejected loans
A process is a set of activities that accepts inputs and
produces outputs.
Processes can involve both goods and services.