Process Flows and Shin Ming Guo Supporting Facility NKFUST - - PDF document

process flows and
SMART_READER_LITE
LIVE PREVIEW

Process Flows and Shin Ming Guo Supporting Facility NKFUST - - PDF document

Process Flows and Shin Ming Guo Supporting Facility NKFUST Process Flow Structures Process Performance Facility Layout Servicescapes 1 https://www.youtube.com/watch?v=-HmFMcZv2xE 1 Definition of a Business Process A


slide-1
SLIDE 1

1

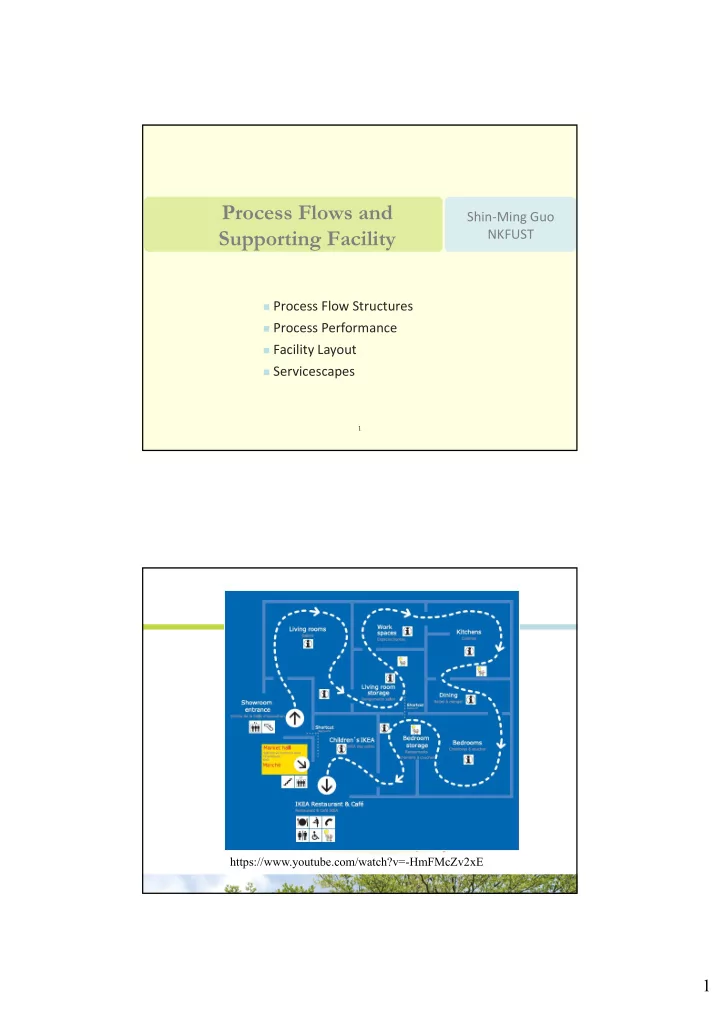
Process Flows and Supporting Facility

1

 Process Flow Structures  Process Performance  Facility Layout  Servicescapes

Shin‐Ming Guo NKFUST

https://www.youtube.com/watch?v=-HmFMcZv2xE

slide-2
SLIDE 2

2

Definition of a Business Process

4

Factory

wood metal guitars

University

students alumni Distribution center bulk items small parcels Calculate credit risk mortgage applications approved loans rejected loans

 A process is a set of activities that accepts inputs and

produces outputs.

 Processes can involve both goods and services.

slide-3
SLIDE 3

3

Services Process Structure

Process Type Service Example Characteristic Management Challenge Project Consulting One‐of‐a‐kind engagement Staffing and scheduling Job Shop Hospital Many specialized departments Balancing utilization and scheduling patients Batch Shop/Process Airline Group of customers treated simultaneously Pricing of perishable asset (seat inventory) Flow Line Cafeteria Fixed sequence of

  • perations

Adjust staffing to demand fluctuations Continuous Process Electric Utility Uninterrupted delivery Maintenance and capacity planning

6

Project Shop

CEO Market Research Finance Operation Human Resource Manager Project A Manager Project B Manager Project C

slide-4
SLIDE 4

4

Job Shop

8

Small batches of customers with different service sequences

1 1 1 2 2 2 3 3 3 4 4 A B C D

Batch Process and Continuous Flow

9

slide-5
SLIDE 5

5

A Flow Line at IKEA’s Cafeteria

10

Process Flow Structures

11

Job Shop Batch Process Worker‐paced line Machine‐paced line Continuous process

Low Volume (unique) Medium Volume (high variety) High Volume (lower variety) Very high volume (standardized) Utilization of fixed capital generally too low Unit variable costs generally too high Commercial Printer Apparel Production/Bakery High volume Auto assembly Oil refinery Low volume Auto Assembly Hospital, Department Store Airline Cafeteria Fast food Internet provider

slide-6
SLIDE 6

6

Process Analysis Terminology

  • Cycle Time is the average time between completions of

successive units.

  • Bottleneck is the factor that limits production usually the

slowest operation.

  • Capacity is a measure of max. output per unit of time.
  • Throughput rate is the actual output per unit of time.
  • Capacity Utilization is a measure of how much output is

actually achieved.

12

Cycle Time Analysis of Slot Machines

13

Insert coin and pull Collect payout if win Machine spinning wait Play again The faster the customer plays, the more money the casino will earn.

slide-7
SLIDE 7

7

Process Analysis Terminology (cont.)

  • Throughput Time is the time to complete a process from time
  • f arrival to time of exit.
  • Rush Order Flow Time is the time to go through the system

without any queue time.

  • Total Direct Labor Content is the sum of all the operations

times.

  • Direct Labor Utilization is a measure of the percentage of time

that workers are actually contributing value to the service.

14

Flow Lines and Cycle Time

  • Process Cycle time = 1 min. Capacity = 60/hour.
  • Direct labor content = 2.5 min. Direct Labor Utilization =

2.5/(5×1)=50%

15

0.1 min 0.7 min 1.0 min 0.5 min 0.2 min 0.5min 0.5 min 0.5 min 0.5 min 0.5 min

 Process Cycle time = 0.5 min. Capacity = 120/hour.  Direct labor content = 2.5 min.  Direct Labor Utilization = 2.5/(5×0.5)=100%

slide-8
SLIDE 8

8

Process with Multiple Types of Customers

  • The flow may break up into multiple flows.
  • Not all activities are required by all types.

16

Product Mix Affects the Process Capacity

17

  • No. of

Workers Available Capacity (minutes) Requested Capacity (Workload) Utilization Senior Staff Intern Total File 1 60 3×4 10×3 4×2 50 83% Contact Persons 2 120 3×30 90 75% Contact Employers 3 180 3×20 10×10 160 89% School/Grade 2 120 10×6 4×6 84 70% Confirmation 1 60 3×4 10×2 4×2 40 67%

Current product mix: 3 senior/hr, 10 staff/hr, 4 intern/hr

slide-9
SLIDE 9

9

Inventory Turns (retail service)

18

 Throughput rate = average daily sales  Throughput time = days of supply  Days of supply =  Inventory turn =

Cost of Goods Sold

_______________________

average inventory value average daily sales average inventory value

________________________ Order Receipt On Shelf Sales

Comparing Kohl’s and Wal-Mart

19

2011 2010 2009 2008 2007 Kohl’s Revenue 18391 17178 16389 16474 15544 Cost of Goods Sold 11359 10679 10332 10459 9890 Inventory 3036 2923 2799 2856 2588 Net Income 1114 991 885 1084 1109 Inventory Turn 3.74 3.65 3.69 3.66 3.82 Walmart Revenue 418952 405046 401244 374526 344992 Cost of Goods Sold 307646 297500 299419 280198 258693 Inventory 36318 33160 34511 35180 33685 Net Income 16389 14335 13118 12884 12036 Inventory Turn 8.47 8.97 8.68 7.96 7.68

slide-10
SLIDE 10

10

20

Design a process to improve flow rate. Design a process to offer more selections. Design a process to reduce wait times. Design a process to control inventory.

Product Layout: How to Allocate Work?

21

Process cycle time = max. cycle time = 60 seconds Process Capacity = Capacity of the bottleneck = 60/hour

slide-11
SLIDE 11

11

Improved Layout of Driver’s License Office

22

Process cycle time = max. cycle time = 30 seconds Process Capacity = Capacity of the bottleneck = 120/hour

Flexible Layout

  • Process cycle time = 30 sec.
  • Process Capacity = 120/hour
  • No waiting in between.
  • No need to repeat information.
  • Flexible staffing.

23

slide-12
SLIDE 12

12

Process Layout: Where to Locate Departments?

24 10 6 6 10 7 5 6 20 4 3 6 6 20 1 7 10 15 2 8 3 10 15 8 8 20 6 30 15 30 8 10 40 12 6 8 5 30 10 10

A B C D E F A B C D E F A B C D E F

Net flow

Flow matrix Triangularized matrix Description of attractions: A=killer whale, B=sea lions, C=dolphins, D=water skiing, E=aquarium, F=water rides.

Ocean World Theme Park (Proposed Layout)

25

(a) Initial layout (b) Move C close to A

Pair Flow distances Pair Flow distances AC 30 x 2 = 60 CD 20 x 2 =40 AF 6 x 2 = 12 CF 8 x 2 =16 DC 20 x 2 = 40 DF 6 x 2 = 12 DF 6 x 2 = 12 AF 6 x 2 = 12 Total 124 CE 8 x 2 = 16 Total 96

(c ) Exchange A and C (d) Exchange B and E and move F

Pair Flow distances Pair Flow distances AE 15 x 2 = 30 AB 15 x 2 = 30 CF 8 x 2 = 16 AD 0 x 2 = 0 AF 6 x 2 = 12 FB 8 x 2 = 16 AD 0 x 2 = 0 FD 6 x 2 = 12 DF 6 x 2 = 12 Total 58 Total 70 A B C D E F A C D B E F C A D B F E A F C E D B

slide-13
SLIDE 13

13

Environmental Psychology & Orientation

 Need for spatial cues to orient visitors  Place orientation (e.g., "Where am I?")  Function orientation (e.g., "How does this

  • rganization work, and what do I do next?").

 Formula facilities draw on previous experience  Anxiety and a sense of helplessness can result if

spatial cues are not present.

Place Orientation

slide-14
SLIDE 14

14

Function Orientation

Environmental Dimensions of Servicescape

30

Ambient conditions Background characteristics (temperature, music, illumination, scent) Spatial layout and functionality Circulation path of customers, groupings of merchandise Signs, symbols, and artifacts Carry special meaning or have social significance.

slide-15
SLIDE 15

15

A Grocery Store’s Layout

Supermarket Psychology

The Psychology Behind a Grocery Store’s Layout

  • The entrance is designed to be inviting so it reinforces a

positive customer retail response.  Bakery, produce and florist at the front of the store.

  • Stock the items shoppers buy most often at the back of

the store  meat, eggs, dairy and bread.

  • Crafting an efficient floor plan with an expertly stocked

perimeter keeps shoppers moving through the entire store and pausing at strategic stops along the way.

  • Pharmacy is located on the perimeter near the exit.
  • Impulse Buys (Candy, Magazines, Etc.) are located by the

registers and exit

slide-16
SLIDE 16

16

Queue Structures

33

Inflow Outflow Customers waiting Customers in service Inflow Outflow Customers waiting Customers in service

Signs, Symbols, and Artifacts

34

slide-17
SLIDE 17

17

35

Servicescape

Summary

A well‐designed service process leads to effective

  • perations and better service.

Three performance measures

 High contact service: throughput rate, wait times  Retail service: inventory

Process analysis can identify the bottleneck and improve the throughput time. Facility layout improves the efficiency and minimizes the travel distance.

36