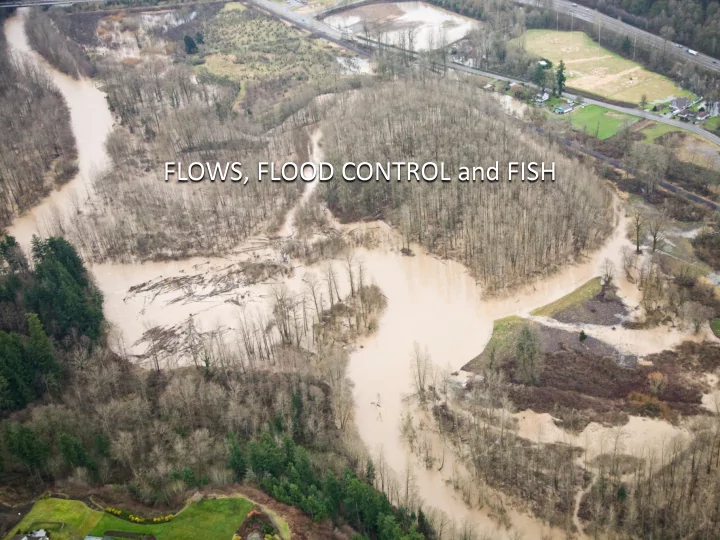

FLOWS, FLOOD CONTROL and FISH
Overview • Alteration of channel-forming flows (2001-2010) – Flood control • reduced channel-forming days from 18 to 17 • reduced the number of years with channel-forming flows from 8 of 10 to 3 of 10 years. • Incubation flows & Chinook survival – Survival and production decline with high flows • Noisy relationships, from uncertain estimates and influences of other factors – Cross-correlation makes interpretation difficult • What is the influence of flood control vs. climate patterns?
30000 Rearing and 25000 Incubation Refuge 20000 Daily Flows (cfs) 15000 Dispersal 10000 5000 0 1-Nov 1-Dec 1-Jan 1-Feb Incubation (11/1-2/28) Flows at Palmer (cfs) WY2009 Without HH With HH Modified from Bunn & Arthington 2002
Actual days >8829 cfs Days >8829 cfs without flood control 9 8 7 6 Total Days 5 4 3 2 1 0 Discharge level from Konrad et al. (In press)
Puget Sound A Duwamish B Lower Middle Photos from Volkhardt et al. D C Upper A: Enter/leave river B: Downstream limit of spawning C: Trap location D: Upstream limit of spawning
900,000 Juvenile Chinook subyearling migrants) 800,000 y = -48.53x + 618750 R² = 0.17 700,000 p = 0.20 600,000 ( p = 0.18) (above trap) 500,000 400,000 300,000 200,000 2009 brood/WY2010 100,000 *only 275 redds in whole mainstem 0 0 2000 4000 6000 8000 10000 Peak daily discharge (cfs) during incubation (11/1-2/28)
Observed Juvenile Chinook subyearling migrants Predicted with flood control Predicted without flood control 1,000,000 (above trap) 800,000 600,000 400,000 200,000 0 Water year (Brood year +1)
900,000 Juvenile Chinook subyearling migrants 800,000 y = -502.42x + 760944 R² = 0.34 700,000 p = 0.06 600,000 ( p = 0.18) (above trap) 500,000 400,000 300,000 200,000 100,000 2010 0 0 200 400 600 800 1000 1200 1400 Median daily discharge (cfs) during incubation (11/1-2-28)
Observed Juvenile Chinook subyearling migrants Predicted with flood control Predicted without flood control 1,000,000 (above trap) 800,000 600,000 400,000 200,000 0 Water year (Brood year + 1)
7% 6% y = -6E-06x + 0.0659 Survival (Pending Revision) R² = 0.34 5% p = 0.06 4% 3% 2% 1% 0% 0 2000 4000 6000 8000 10000 Peak daily discharge (cfs) during incubation (11/1-2/28)
Climate variability What role does flood control play Spawning/incubation Rearing & Refuge in habitat restoration? Fewer side channels? Reduced scour depth? Reduced gravel? Reduced displacement? Less wood? Floodplain refuge? = Takes the ‘edge’ off high water years? = long-term decline in productivity/capacity?
Summary • Alteration of channel-forming flows (2001-2010) – Flood control has • reduced channel-forming days from 18 to 17 • reduced the number of years with channel-forming flows from 8 of 10 to 3 of 10 years. • Incubation flows & Chinook survival – Survival and production typically decline with high flows • Other factors are at work, too. – Cross-correlation makes interpretation difficult • What is the influence of flood control vs. climate patterns? – Working with WDFW to better understand what we are seeing in the data
Recommend
More recommend