
SLIDE 1
Photo Credit: WSDOT
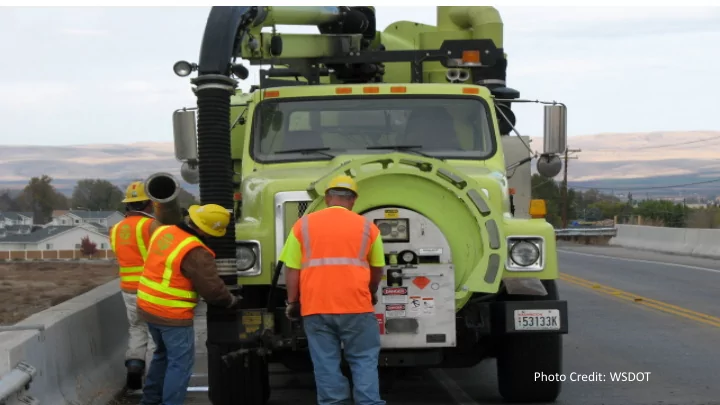
Photo Credit: WSDOT Catch Basin Effectiveness Study Jene Colton, - - PowerPoint PPT Presentation
Photo Credit: WSDOT Catch Basin Effectiveness Study Jene Colton, King County Stormwater Work Group meeting November 14, 2018 How can we use WW catch basin I&M records to inform inspection frequency needs? Steps Compile Info Analysis
Photo Credit: WSDOT
Jenée Colton, King County Stormwater Work Group meeting November 14, 2018
Recommendations ID Drivers Analysis Compile Info
Thurston and Whatcom County submitted surveys
Less Frequent Circuit 100% Cleaning Standard
Uncommon
https://creativecommons.org/licenses/by-nd/2.0/legalcode
Photo Credit: Oregon DOT
Photo: Dhs Commtech at English Wikimedia
Photo Credit: NoDerivs 2.0 Generic License://creativecommons.org/licenses/by-nd/2.0/legalcode
Kalama, WA Photo Credit: Joe Mabel
Grate Inlet
Outlet
Invert – Outlet Pipe Top of Solids Bottom of Sump
SUMP
Drainage Area for CB 1 Drainage Area for CB 2 Drainage Area for CB 3
Recommendations ID Drivers Analysis Compile Info
Detour
CB Z
10 30 50 70 90 110 130 150 500 1000 1500 2000 2500
% of Sump
Days
Everett King County Tacoma
20 40 60 80 100 120 Jan-10 Aug-10 Feb-11 Sep-11 Apr-12 Oct-12 May-13 Nov-13 Jun-14
Percent Full
Inspection Dates
Each color is different CB
CB Z
5% 7.5% 18% 14% 4% 34% 22% Everett Kent King County SPU MS4 SPU CSO Tacoma WSDOT
5 10 15 20 25 30 35 40
9.7% 9.2% 51%
10 20 30 40 50 60
Everett King County Tacoma
Percent of CBs Failing Within 2 Years: Low Confidence Tier Data
High Confidence
CB Z
CB Z
CB Z
based on 2 x # years
etc…similar maintenance needs
Marysville Circuits
inspection data.
inspection data.
based prediction of CB sediment accumulation.
King County Blair Scott Mark Preszler Nick Hetrick Brent Dhoore Doug Navetski Osborn Consulting Inc. Diana Hasegan Laura Ruppert
Technical Advisory Committee Angela Gallardo (Kitsap County) Laura Haren (City of Kent) Grant Moen (City of Everett) Kate Rhoads (City of Seattle) Cardno Jonathan Ambrose SAM Coordinator Brandi Lubliner
20 40 60 80 100 120 140 160 500 1000 1500 2000
% Sump Full Days Since Cleaning
Everett King County Tacoma
20 40 60 80 100 120 140 500 1000 1500 2000 2500
% Sump Full Days Since Cleaning
Everett King County Tacoma