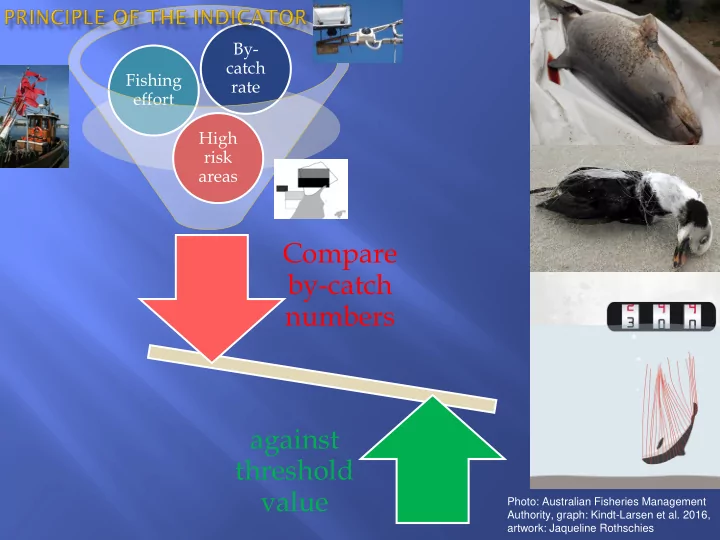
compare by catch numbers against threshold value
play

Compare by-catch numbers against threshold value Photo: - PowerPoint PPT Presentation

By- catch Fishing rate effort High risk areas Compare by-catch numbers against threshold value Photo: Australian Fisheries Management Authority, graph: Kindt-Larsen et al. 2016, artwork: Jaqueline Rothschies By- catch Fishing


  1. By- catch Fishing rate effort High risk areas Compare by-catch numbers against threshold value Photo: Australian Fisheries Management Authority, graph: Kindt-Larsen et al. 2016, artwork: Jaqueline Rothschies

  2. By- catch Fishing rate effort High risk For all relevant metiers areas fisheries data needs non-fisheries data needs Monitoring of by-catch By-catch rate per effort (number / km x hrs) Monitoring of effort Fishing effort for all vessels including recreational fishing Identify and take high- Spatial effort data risk areas into account and by-catch positions (scientific task) Calculate by-catch numbers population size and Assessment: Relate to identity, assessment population value (scientific task)

  3. red-throated diver Gavia stellata

  4. common guillemot ( Uria aalge )

  5. black guillemot ( Cepphus grylle )

  6. velvet scoter ( Melanitta fusca )

  7. long-tailed duck ( Clangula hyemalis )

  8. JWGBIRD 2015 Figure 2.2. Survey effort of the first coordinated joint winter survey in winter 2015/2016 in the Baltic Sea and southern North Sea. Most effort refers to aerial surveys, but ship-based surveys were conducted as well.

Download Presentation
Download Policy: The content available on the website is offered to you 'AS IS' for your personal information and use only. It cannot be commercialized, licensed, or distributed on other websites without prior consent from the author. To download a presentation, simply click this link. If you encounter any difficulties during the download process, it's possible that the publisher has removed the file from their server.

Recommend


More recommend