
SLIDE 1
Tony Houston Assistant Director Safety IATA – Asia Pacific
Overview Accident Trends Global / Asia Pacific Five Year Summary / - - PowerPoint PPT Presentation
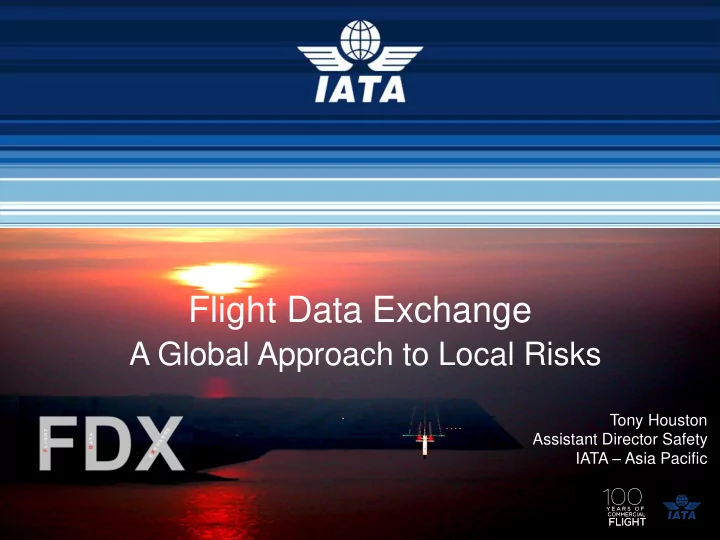
Flight Data Exchange A Global Approach to Local Risks Tony Houston Assistant Director Safety IATA Asia Pacific Overview Accident Trends Global / Asia Pacific Five Year Summary / 2012 Flight Data Aviations most important safety
Tony Houston Assistant Director Safety IATA – Asia Pacific
OPC/24 Agenda item x.y 2 1-2 November 2011, Delhi
Global / Asia Pacific Five Year Summary / 2012
“Aviation’s most important safety tool” An ICAO and IOSA requirement
Flight Data Exchange
How FDX can be an effective risk management tool Why all airlines should subscribe
OPC/24 Agenda item x.y 3 1-2 November 2011, Delhi
3
OPC/24 Agenda item x.y 4 1-2 November 2011, Delhi
IATA Safety Report 2012
4
2013 – 17 accidents / 2009 to 2013 – 73 accidents Breakdown by Category Distribution of accidents by percentage of region total
Latent Conditions (deficiencies in…) Threats Flight Crew Errors (relating to…) Undesired Aircraft States (UAS)
50% Regulatory
Environmental
38% Manual handling/flight controls 27% Long, floated, bounced, firm,
crabbed landing 34% Meteorology
Wind/ wind shear/ gusty wind (78% of events) Thunderstorms (22% of events)
41% Safety management 20% Ground-based nav aids not available 27%
SOP
adherence/cross- verification; intentional non- compliance 23% Vertical / lateral speed deviation 19% Flight operations: Training systems 11% Contaminated runway / taxiway 9%
Failure to go-around after destabilization
14% Unstable approach
Airline
13% Continued landing after unstable approach 13% Aircraft malfunction
OPC/24 Agenda item x.y 8 1-2 November 2011, Delhi
Latent Conditions
Deficiencies in…)
Flight crew Training Flight Ops SOPs Ops Pressure Safety Management Threats Meteorology ANSP/ATC Interface Airport Facilities Aircraft Malfunction
Flight Crew Errors (relating to…) Manual Handling Flight Controls SOP adherence / Procedural Communication Failure to go-around after destablization Undesired Aircraft States (UAS) Vertical, lateral or speed deviations Long, forced, bounded, firm or off-centerline landing Unstable Approach Continued Landing after unstable approach End State Runway Excursion
OPC/24 Agenda item x.y 9 1-2 November 2011, Delhi
light Crew Errors (relating to…) Manual Handling light Controls SOP adherence / Procedural Communication ailure to go-around after destablization
Undesired Aircraft States (UAS) Vertical, lateral or speed deviations Long, forced, bounded, firm or off-centerline landing Unstable Approach Continued Landing after unstable approach End State Runway Excursion
OPC/24 Agenda item x.y 10 1-2 November 2011, Delhi
The first step to managing anything is to measure it
OPC/24 Agenda item x.y 11 1-2 November 2011, Delhi
Compare Standard Operating Procedures (SOPs) with those performed in everyday line flight Feedback loop within the Safety Management System (SMS) to monitor corrective actions FDM data can also be used to identify training gaps
(Also Known as FDM, OFDM, FOQA or FDA)
OPC/24 Agenda item x.y 12 1-2 November 2011, Delhi
Most National Aviation Authorities (NAAs) have introduced a legal requirement for FDM
A requirement for international civil aviation aircraft over 27 tonnes Is recommended for aircraft over 20 tonnes “A flight data analysis programme shall be non-punitive and contain adequate safeguards to protect the source(s) of the data.”
OPC/24 Agenda item x.y 13 1-2 November 2011, Delhi
The Operator should have a hazard identification program… i) A combination of reactive and proactive methods for safety data collection; ii) Processes for safety data analysis that identify existing hazards and predict future hazards to aircraft operations. Note - Effective 1 September 2015, this recommended practice will be upgraded to a standard
OPC/24 Agenda item x.y 14 1-2 November 2011, Delhi
The Operator shall have an FDA program that is non-punitive and protects data sources. Confidential Reporting Investigation of Accidents / Incidents Flight data analysis Observation of crew performance Quality Assurance / Safety Auditing Safety information exchange from external sources
have a team working on issues you didn’t even know existed anticipate safety concerns at new airports or new routes compare your operations against the entire industry compare global and regional statistics
…would you?
In FDX, Data is also sent to IATA where it gets processed using a common set of events including:
airline IATA
Data is sent through secure FTP
Data files are stored and identifying information is removed During the processing of the data file in the FDM software, the flight number and tail number fields are removed and the flight date parameter is set to the first day of the month in the RAW binary file level A new binary file is generated The original data file that came from the airline is permanently deleted from IATA’s servers The de-identified file is kept for the purposes
No other person other than the IATA FDX analysis team can have access to the database or the de-identified data file. The web portal does not contain any information on sectors or airlines. The web portal only displays airports with at least 3 airlines flying into/from them Global FDX data can be accessed by the airline through the web portal
20 Safety Group Meeting
5000 10000 15000 20000 25000 30000 35000 40000
Total Flight Count
5000 10000 15000 20000 25000 30000 ม.ค.-09 มี.ค.-09 พ.ค.-09 ก.ค.-09 ก.ย.-09 พ.ย.-09 ม.ค.-10 มี.ค.-10 พ.ค.-10 ก.ค.-10 ก.ย.-10 พ.ย.-10 ม.ค.-11 มี.ค.-11 พ.ค.-11 ก.ค.-11 ก.ย.-11 พ.ย.-11 ม.ค.-12 มี.ค.-12 พ.ค.-12 ก.ค.-12 ก.ย.-12 พ.ย.-12
Breakdown Per Region
LATAM AFI ASPAC EUR MENA
web portal reports
The database outputs data in two forms
The web portal shows data against a world map background which in this example is showing airports with unstable approaches. The user can only see airports with at least 3 airlines flying into them.
Average Values and Trends of Event Rates per region are populated depending on the event type and time range selected
FDX Data supported business case for improved instrument approach procedures
Included in FDX is a Global Animation Archive, where animations are created during the course of the program. Contributing airlines can share and use these animations for training and safety awareness. Data is always de-identified.
Typically Cover
Global and Regional benchmarks Airport analysis (Airport Safety Index) Analysis on specific events
local level Identify common issues in the region
OPC/24 Agenda item x.y 32 1-2 November 2011, Delhi
OPC/24 Agenda item x.y 33 1-2 November 2011, Delhi
www.flying100years.com