
SLIDE 1
CONFIDENTIAL
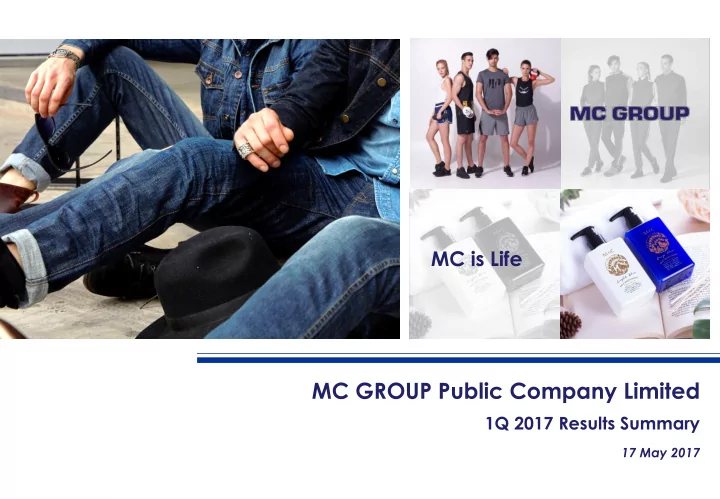
MC GROUP Public Company Limited
1Q 2017 Results Summary
17 May 2017
MC GROUP Public Company Limited 1Q 2017 Results Summary 17 May 2017 - - PowerPoint PPT Presentation
MC is Life MC GROUP Public Company Limited 1Q 2017 Results Summary 17 May 2017 CONFIDENTIAL MC is Life MC GROUP Public Company Limited 1Q 2017 Results Summary 17 May 2017 CONFIDENTIAL Disclaimer The information contained in our
CONFIDENTIAL
17 May 2017
CONFIDENTIAL
17 May 2017
2
CONFIDENTIAL
Pages Recent Developments 3 Financial Results 10 2017 Outlook & Guidance 22
3
4
CONFIDENTIAL
5
Summer shirt: Hawaiian style New collars
Slim Half-Collar Collarless Mandarin Peter Pan
New shapes
Boyfriend Loose Bat Wing
New designs
CONFIDENTIAL
6
7
Brand Free- Standing Modern Trade Mobile unit Int'l Total 249 468 6 15 738 11 1 12 5 5 1 1 20 20 20 87 107 Total 301 561 6 15 883
End of 2016 # Points of Sales
End of 1Q17 # Points of Sales
(-14)
Brand Free- Standing Modern Trade Mobile unit Int'l Total 249 471 6 20 746 11 1 12 5 5 10 1 1 21 21 21 86 107 Total 303 563 6 25 897
8
www.mcshop.com
On-line Promotions at mcshop.com Off-line & On-line Cross Promotions Participation to win prizes Introduction of Mr. & Ms. Mc Introduction of Product Content
9
Tablet deployment and PC training at Mc Jeans shops (> 250 points of sales) Implementation of 14 days exchange guarantee at all Mc Jeans Shops
10
11
12
(THB millions)
Sales Revenue
Gross Profit
EBITDA
Net Profit
Net Profit Margin
EPS (THB)
Modern Trade 39%
13
+14% YoY
Free Standing 57% 52% 44% 4%
Q1/16 Q1/17
Other 4%
(THB millions)
+7% YoY
14
Remark: (1) Figures are calculated based on modern trade sales revenue, before GP. Excluded sales from international markets and other source (i.e., exhibition etc.)
’000 THB
THB
15
Total System Growth Same Store Sales Growth Remark: Hypermarkets are not included in the calculation.
Free standing shop Modern Trade
16
Remark: Hypermarkets are not included in the calculation.
Bangkok Upcountry
17
(THB millions)
65.0%
Gross Profit Gross Profit Margin Gross Profit Margin (excl TDC)
+5% YoY
+11% YoY
18
(THB millions)
+4% YoY +7% YoY
19
(THB millions)
+18% YoY
65.0%
EBITDA EBITDA Margin EBITDA Margin (excl TDC)
+13% YoY
20
15% YoY
65.0%
Net Profit Net Profit Margin Net Profit Margin (excl TDC)
(THB millions)
14% YoY
21
(THB millions)
2016 Q1/17 Cash & Cash Equivalent 1,277 1,532 Accounts Receivable 787 725 Inventory 1,989 1,925 Other Assets 1,144 1,173 Total Assets 5,196 5,355 Accounts Payable 425 396 Interest-bearing Liabilities 147 123 Other Liabilities 338 314 Total Liabilities 910 833 Shareholders' Equity 4,286 4,521
22
THB millions THB millions
23
24
25
26
Line ID: @mc_jeans