Linear and Nonlinear Optics of Bichromatically Driven Raman - - PDF document
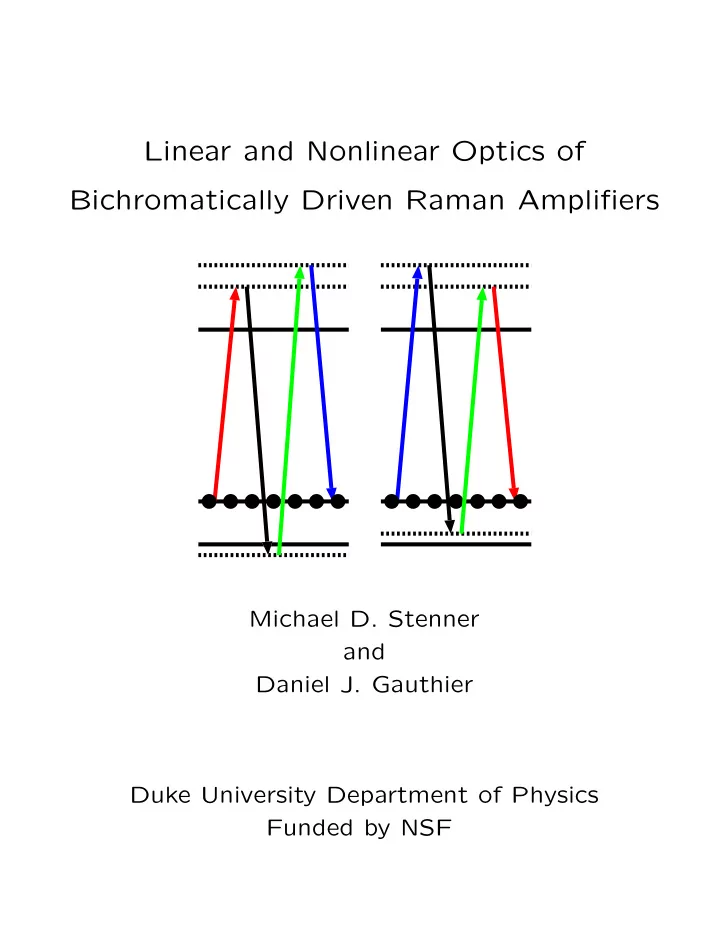
Linear and Nonlinear Optics of Bichromatically Driven Raman Amplifiers Michael D. Stenner and Daniel J. Gauthier Duke University Department of Physics Funded by NSF Recent Results in Dispersion Tailoring 1. Slow Light 0 < v g < c 2.
Recent Results in Dispersion Tailoring
- 1. Slow Light∗
0 < vg < c
- 2. Fast (Superluminal) Light†
vg > c vg < 0
vapor cell vacuum
- 3. “Stopped” light‡§
vg = 0
∗L. V. Hau, S. E. Harris, Z. Dutton and C. H. Behroozi, Nature 397,
594–598 (1999).
†L. J. Wang, A. Kuzmich and A. Dogariu, Nature 406, 277–279 (2000). ‡C. Liu, Z. Dutton, C. H. Behroozi and L. V. Hau, Nature 409, 490–493
(2001).
§D. F. Phillips, A. Fleischhauer, A. Mair, R. L. Walsworth and M. D.
Lukin, Phys. Rev. Lett. 86, 783–786 (2001). 2
New Anomalous Dispersion Technique
A new method for creating anomalous dispersion was recently proposed∗ and implemented.†
- 4
- 2
2 4 frequency refractive index (n-1) absorption coefficient (α) anomalous dispersion
We are interested in studying this system in the high gain limit.
∗A. M. Steinberg and R. Y. Chiao, Phys. Rev. A 49, 2071–2075 (1994). †L. J. Wang, A. Kuzmich and A. Dogariu, Nature 406, 277–279 (2000).
3
Creation of Bichromatic Raman Gain
ω1 ω2 ω1 ω2 K vapor cell
39
ω1 ω2
- L. J. Wang, A. Kuzmich and A. Dogariu, Nature 406, 277–279 (2000).
(Wang et al. used red-detuned Raman pumps in cesium.) 4
Wang et al.’s Interpretation of this New Technique
χ(ω) = M (ω − ω1) + iγ + M (ω − ω2) + iγ
- 4 -2
2 4
- 4 -2
2 4
- 4 -2
2 4 frequency refractive index (n-1) absorption coefficient (α)
However, this is only part of the picture. This is not valid for high gain!
5
Another Process Contributing to the Susceptibility: Four-Wave Mixing
We have discovered that in the high gain limit, a new process becomes important. ω1 ∆ω ω2 ω1 ω2 ωp ∆ω ωp K vapor cell
39
∆ω ωp This process was not important in the experiment
- f Wang et al.
6
Spatial Evolution of New Frequencies
- riginal
frequency new frequency intensity (arb units) gz high gain low gain I( ) ω ωprobe ω I( ) ω ωprobe ω
7
Our High Gain Experiment
ω1 ∆ω ω2 ω1 ω2 ωp K vapor cell
39
frequency refractive index (n-1) absorption coefficient (α) 25 MHz α0L = -9.5
probe pump
power ≈ 1 µW power ≈ 25 mW spot size = 100 µm spot size = 280 µm pump detuning ∆ω = 25 MHz
8
Production of Short Pulses and Pulse Advancement
200 400 600 800 time (ns) intensity (arb units)
- utput
input
single pulse
200 400 600 800 time (ns) intensity (arb units)
averaged pulse
input
- utput
vg = −0.005c τp = 184 ns tadv = 130 ns
9
Conclusions
- Bichromatically pumped Raman amplifier is
nonlinear to lowest order in probe (pulse) intensity!
- This has not been considered in prior experi-
ments, because it is not important in the low gain limit.
- Our high gain experiments show that a “pulse”
still propagates with fast vg on average, despite the creation of new frequencies.
10
Generation of New Frequencies
RF spectrum of light on the detector:
100 200 300 400 500 frequency (MHz)
- 70
- 60
- 50
- 40
- 30
- 20
- 10
I(ω) (dB
11