HIGH END SOLUTION FOR HIGH QUA LITY FLEX O Content Content Key - - PowerPoint PPT Presentation

high end solution for high qua lity flex o content content
SMART_READER_LITE
LIVE PREVIEW

HIGH END SOLUTION FOR HIGH QUA LITY FLEX O Content Content Key - - PowerPoint PPT Presentation

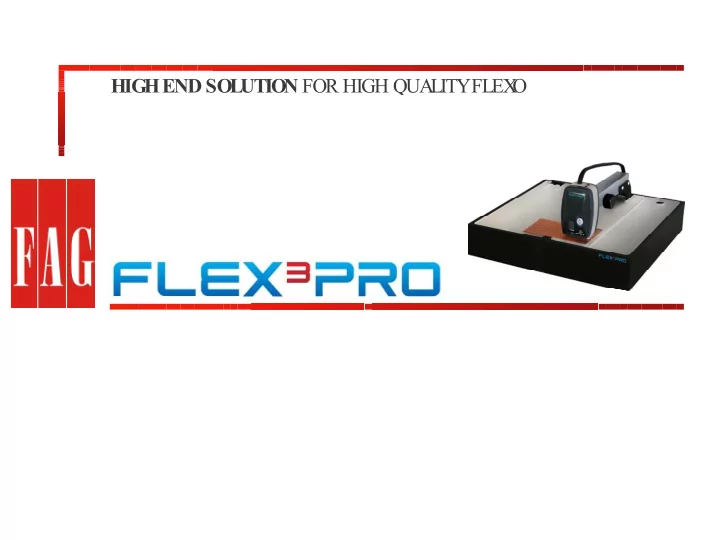
HIGH END SOLUTION FOR HIGH QUA LITY FLEX O Content Content Key design principles Control your Flexo process Setup and control your laser Stain density Focus, laser power Control your finished plate Why


slide-1
SLIDE 1

HIGH END SOLUTION FOR HIGH QUA LITY FLEX O

slide-2
SLIDE 2

Content Content

  • Key design principles
  • Control your Flexo process
  • Setup and control your laser
  • Stain density
  • Focus, laser power
  • Control your finished plate
  • Why checking the dot with the lens is not good enough
  • Let‘s talk about the minimum dot
  • Control your printing product
  • Measure the dot size
  • Measure the dot void

2

slide-3
SLIDE 3

Key design principles for a Key design principles for a High End High End Flexo Flexo Control Device Control Device

  • Positioning arm for transmission readings
  • Directed light source requires exact positioning
  • Free hand use in reflection modes and 3D

mode possible

  • Transportable unit in self containing box
  • Connected and powered by USB
  • Calibration target on glass included
  • Windows XP SP3, Vista and Windows 7
  • Designed by the VIPFLEX developer team

based on 13 years of experience in Flexo control devices

3

slide-4
SLIDE 4

Laser setup: control the stain density Laser setup: control the stain density

What is stain density?

  • The control of the stain density is an important step in digital flexo.
  • The stain density tells you, how much LAMS remains on your polymer after ablation.
  • The Laser should be set up such as the 100% patch is as clean as possible
  • A stain density of 0.08 to 0.085 is a good setup
  • The stain density has been controlled up to now with a transmission densitometer
  • The transmission densitometer is not needed any more and can be replaced by the

FLEX³PRO

  • CAUTION: The density measurement on the 50% patch has nothing to do with the

stain density! Checking the 50% patch to measure a density of 0.3 gives you an idea about the linearity of your Laser. It is not the state of the art any more to use the densitometer for linearity control since image analysis measurement devices are available.

4

slide-5
SLIDE 5

Laser setup: control the stain density with FLEX Laser setup: control the stain density with FLEX³ ³PRO PRO

  • Image a 100% patch
  • Clean the polymere from LAMS using a tape. In case
  • f Asahi plates, double image a 100% patch
  • Select the plate type Stain Density on the page

TRANSMISSION.

  • Position the taped (or double ablated) area below the

aperture, lower the sensor head and click ZERO.

  • Now position the 100% patch below the aperture,

lower the sensor head and click STAIN.

  • The stain density as density difference between taped

(double ablated) area and 100% patch is displayed.

  • The FLEX³PRO is an intelligent densitometer, that

measures only on ablated areas and does exclude high density areas. This makes the stain density control significantly more accurate, as dust or non perfect clean reference areas are not having an impact

  • n the overall measurement result.

Taped area 100% Patch

5

slide-6
SLIDE 6

Setup and control your Laser: Control the linearity Setup and control your Laser: Control the linearity

Imaged at 700RPM

  • Image a 50% patch (Pixel oriented)
  • Select Masked Plates from the Plate

type List.

  • Measure the 50%patch
  • Laser focus, laser power, and

imaging speed has an impact on the linearity of the output

  • A good Laser speed (RPM) laser

power balance is reached, if the 50% patch is close to 50% patch

Imaged at 1000RPM

Sample images are available in the directory PERET/FLEX3PRO/images/ImgCompare

6

slide-7
SLIDE 7

Setup and control your Laser: fully understand the Setup and control your Laser: fully understand the impact of variations in Laser parameters impact of variations in Laser parameters

  • Select Image Compare from the Tools menu
  • Load the sample image ‘MASK700RPM’ into

the blue frame

  • Load the sample image ‘MASK1000RPM’ into

the yellow frame

  • Select with the mouse 2 dots in each frame
  • Click compare. The images are automatically

scaled, rotated and overlaid showing the difference

  • In this example we can see that the dot area

difference on the preview slide is motivated by

  • Engraving traps removed
  • Rounding of the dot (TIFF structure gets lost with

higher laser power)

7

slide-8
SLIDE 8

Image Compare: a simple, but very powerful tool Image Compare: a simple, but very powerful tool

  • Compare masked plates produced with different

laser parameter settings

  • Compare mask with finished plate
  • Compare cyan plate with yellow plate
  • Compare re-make job plate with original plate
  • Compare plate before print and plate after print
  • Compare plate with print
  • Compare cyan print with yellow print

Images are much more easy to understand than just numbers

Dot loss due to oxygen inhibition

8

slide-9
SLIDE 9

Control your finished Control your finished flexo flexo plate plate

  • Select the proper plate type from the Plate type list.

Most of the plates work with Medium Flexo Plates.

  • Position the control patch below the aperture and

lower the Sensor. Measure the patch.

  • Collect measurements in the statistic to see
  • Your print curve
  • Variations of the 50% on different locations of the plate
  • Fast operation:
  • Press F2 for preview
  • Press F4 for capture and analysis
  • Press F6 to add measurement to statistics

Start with F2… 9

slide-10
SLIDE 10

Control the finished plate Control the finished plate

  • Measure the dot area of various

patches

  • Collect data in the statistics
  • Draw curve
  • Compare with reference curve
  • Calculate average and standard

deviation

  • Use the image compare to

evaluate the dot loss between mask and finished plate

  • Print a report
  • Save images and compare plate

before and after print

10

slide-11
SLIDE 11

Elastomeric Elastomeric Plates, Plate on steel, offset plates are Plates, Plate on steel, offset plates are measured in REFLECTION measured in REFLECTION

  • Measure in automatic
  • Select manually dots
  • Measure manually dots

11

slide-12
SLIDE 12

Measure Flint WS Mask and Plate Measure Flint WS Mask and Plate

In order to meet the needs in security printing there have been added proper features to the system

Letterpress Mask Letterpress Plate Multi Line measurement function

12

slide-13
SLIDE 13

Measure line width with high precision Measure line width with high precision

  • Measure your line width
  • On mask
  • On plate
  • On print
  • To make sure your bar codes

read correctly

13

slide-14
SLIDE 14

Let Let‘ ‘s talk about the minimum DOT s talk about the minimum DOT

Dots are looking the same from top while looking quite different in 3D! TOP View analyzes is not sufficient to control high light dots!

14

slide-15
SLIDE 15

While the transmission image still shows dots, the dots are not While the transmission image still shows dots, the dots are not stable enough to print during the entire run of the job. stable enough to print during the entire run of the job.

Will this dot print as a dot or will it break at the beginning

  • f the job and print as a

line? For how long will this dot print as a dot before breaking? This dot might be stable enough to print for the entire run of the job

15

slide-16
SLIDE 16

FLEX FLEX³ ³PRO Dot Shape function PRO Dot Shape function

Use the Dot Shape function to make sure:

  • That the dots look the same at the left side, the

right side and in the middle of the plate

  • The dots on the magenta plate look the same as

the dots on the cyan plate and the yellow plate

  • The dots of the re-make job look the same as the

dots of the original job

  • Compare highlight dots before print and after print

Don‘t use the Dot Shape function to

  • Compare one plate material / process with another

plate material / process!

  • The required dot shape is defined by plate material,

screen type, printing environment, substrate, inks, number of copies, and many other parameters …

(D10+D30+D60) * (D60-D10) 50µm

Index =

16

slide-17
SLIDE 17

How to use the powerful dot shape function How to use the powerful dot shape function

Are all dots looking the same?

  • n different locations of the same plate
  • On the cyan plate and the magenta plate
  • On the re-make job plate and the original plate
  • Before print and after print
  • Store a reference dot
  • Compare the actual dots with the reference using the

ghost image function (CTRL key while moving the mouse)

  • Measure diameters, angles and heights
  • Save the JPG image (right mouse click inside the

image)

17

slide-18
SLIDE 18

Measure the finished plate: Measure the finished plate: Is a lens and a light table good enough? Is a lens and a light table good enough?

  • 1% Dot at 59 L/cm
  • Expected dot diameter is 19µm
  • Measurement with FLEX³PRO
  • Dot Area is 1.32%
  • Dot Diameter is 21.9 µm
  • Simulated lens approach
  • Standard light table
  • Plate in upside down position
  • Dot Area measured is 4.13%
  • Dot Diameter measured is 38.9 µm

What‘s wrong?

18

slide-19
SLIDE 19

The directed light source advantages: The directed light source advantages:

FLEX³PRO

  • Directed (parallel) transmission light

source:

  • Flat area -> white
  • Non flat area -> Black

Lens approach

  • Standard light table
  • Small change in steepness -> bright
  • Large change in steepness -> dark

Red: real dot shape / plateau Yellow: wrong plateau seen with lens

Lens can be used Lens can NOT be used The lens approach works only if the printing dot surface edge has a sharp cut in steepness!

19

slide-20
SLIDE 20

Flexo printing : control your dot shape! Flexo printing : control your dot shape!

  • It is now important to use

technology, that can clearly distinguish between flat printing dot surface and shoulder portion

20

slide-21
SLIDE 21

Use FLEX Use FLEX³ ³PRO and FLEYEplus for daily work PRO and FLEYEplus for daily work

  • 0% area
  • for Relief depth measurements
  • White or transparent of print
  • 100% Patch
  • Stain Density
  • Density on print
  • 50% Patch (by Pixel)
  • Plate making process Linearity (black box)
  • Dot Gain on print
  • Minimum Dot (DFTA Wedge A..U)
  • Dot Shape on Plate
  • Minimum dots on Print
  • 50% Patch (by Vector)
  • Impact of Workflow, Image setup, …

21

slide-22
SLIDE 22

Quick Laser Check with FLEYEplus Software Quick Laser Check with FLEYEplus Software

22

slide-23
SLIDE 23

Quick Plate Check with FLEYEplus Software Quick Plate Check with FLEYEplus Software

23

slide-24
SLIDE 24

Control your printing product Control your printing product

  • A densitometer is used to control density and dot

gain on print

  • A spectrophotometer is used to control the visual

impression of the printed color (CIE Lab)

  • Mechanical characteristics of the dot are

measured with FLEX³PRO

  • Mechanical dot size, dot deformation
  • control pressure plate : substrate
  • Dirt / little ink spots around the dot – visual control
  • Pressures to high
  • Remake a job with unknown screen rulings, dot gains

etc?

  • Measure directly the printed sample in an overprint

area

24

slide-25
SLIDE 25

Control your printing product Control your printing product

  • Dot Void (low density areas inside the

dot)

  • Ink problem, corona-treatment of

substrate, storage of the substrate

  • Compare plate image with print image
  • Check mechanical dot gain
  • Check changes in screen ruling because
  • f plate stretching
  • Print problems in yellow?
  • Roundness of yellow printing unit?
  • Diameter of yellow plate cylinder?
  • Thickness of tape?

25

slide-26
SLIDE 26

How to measure HD How to measure HD-

  • Flexo

Flexo on print

  • n print
  • HD-Flexo dot area is measured with

FM setting

  • No regular screen ruling
  • No regular dot size
  • Single dot size measurement in HD-

Flexo

  • Select Fixed screen ruling with

60L/cm

  • Select Manual selection of dots
  • Click inside the dot to be measured
  • Click Manual again to get
  • Dot Diameter
  • Dot Surface Area
  • Dot Perimeter
  • Edge Factor
  • Ignore dot area and screen rulings

26

slide-27
SLIDE 27

Mottle Mottle – – high density can be achieved only with low high density can be achieved only with low mottle effect mottle effect

  • Solid area coverage
  • Low mottle example : 6.00
  • Middle mottle example : 18,78
  • High mottle example : 34.61
  • The mottling effect has an impact on dot gain

measures obtained with a densitometer

  • The mottling effect limits the maximum density
  • f solid areas. If f.e. 10% of the area are not

covered with ink, the density can never be higher than 1.0, independently from the amount of ink the press is transferring

  • Reduction of mottling means ink saving
  • Reduction of mottling means higher density

and better contrast images and better print quality

27

slide-28
SLIDE 28

Coverage matches humand judgement Coverage matches humand judgement

28

slide-29
SLIDE 29

What What‘ ‘s different? s different?

  • ISO is a simple

standard deviation of density measurements

  • FLEX³PRO Mottle

takes into account that bright areas are more critical than dark one

  • Humand judgement is

sensitive to the size of the void areas

29

slide-30
SLIDE 30

Use the Use the densitometer densitometer do control your print quality do control your print quality

Once the mechanical parameters of your printing process are correct, the densitometric characteristics have to be checked.

  • Measure solid density
  • To make sure your printing product shows saturated

colors

  • Measure dot gain
  • To make sure your printing product shows all

drawing details

  • Measure densitometric surface coverage
  • To make sure your print curve is right
  • Measure balance
  • To make sure your gray tones are correct

30

slide-31
SLIDE 31

Complete process control with FLEX Complete process control with FLEX³ ³PRO PRO

  • Control laser by controlling mask
  • Control processor / exposure / washout by controlling finished plate
  • Control minimum dots to avoid dot gain problems on highlights

during print

  • Control plate before print and after print
  • Control mechanical dot size and shape on print
  • Control density, dot gain, balance with the densitometer

31