
SLIDE 1
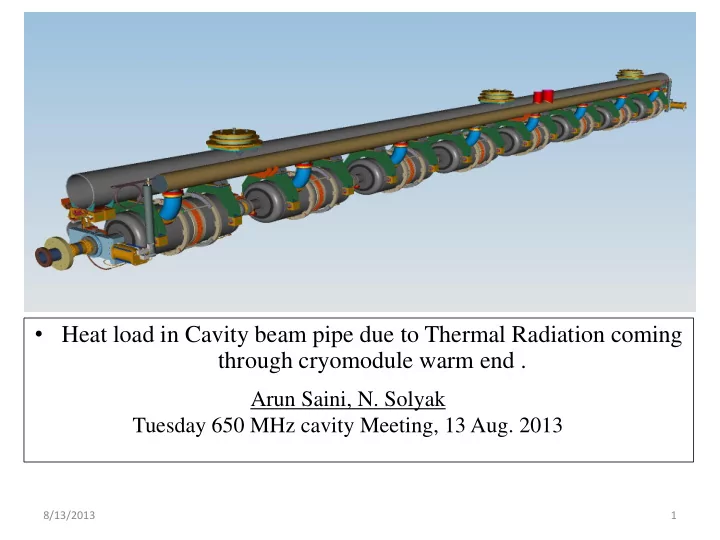
- Heat load in Cavity beam pipe due to Thermal Radiation coming
through cryomodule warm end .
Arun Saini, N. Solyak Tuesday 650 MHz cavity Meeting, 13 Aug. 2013
8/13/2013 1