Group revenues of MNOK 2,145 in Q4 2010, 23 % growth since last - - PDF document

group revenues of mnok 2 145 in q4 2010 23 growth since
SMART_READER_LITE
LIVE PREVIEW

Group revenues of MNOK 2,145 in Q4 2010, 23 % growth since last - - PDF document

Double digit revenue growth in Q4 Group revenues of MNOK 2,145 in Q4 2010, 23 % growth since last year Domestic revenue: MNOK 848 (+5 %) International revenue: MNOK 1,297 (+37 %) Revenues 1,145 1,615 1,750 2,145 Domestic


slide-1
SLIDE 1

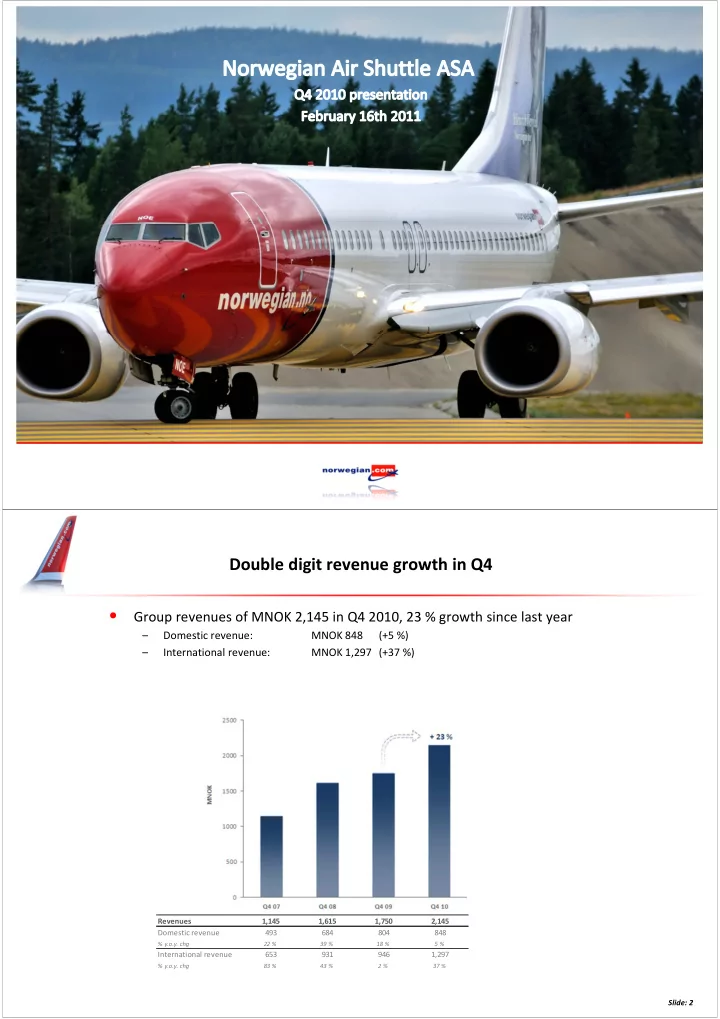
Revenues 1,145 1,615 1,750 2,145 Domestic revenue 493 684 804 848

% y.o.y. chg 22 % 39 % 18 % 5 %

International revenue 653 931 946 1,297

% y.o.y. chg 83 % 43 % 2 % 37 %

Double digit revenue growth in Q4

  • Group revenues of MNOK 2,145 in Q4 2010, 23 % growth since last year

– Domestic revenue: MNOK 848 (+5 %) – International revenue: MNOK 1,297 (+37 %)

Slide: 2

slide-2
SLIDE 2

Q4 07 Q4 08 Q4 09 Q4 10 EBIT/ operating margin

  • 5 %
  • 12 %

0 %

  • 1 %

Q4 07 Q4 08 Q4 09 Q4 10 EBITDAR margin 3 %

  • 3 %

12 % 10 %

Slightly negative Q4 operating result following adverse weather and Spanish industrial actions

– EBITDAR MNOK + 214

(+205)

– EBITDA MNOK + 14

(+50)

– Operating profit (EBIT) MNOK

  • 32

(+ 8) .

– Pre-tax profit (EBT) MNOK

  • 27

(+ 9)

– Net profit MNOK

  • 5

(+ 1)

Slide: 3

EBIT development Q4 EBITDAR development Q4

Revenue growth of 1.3 billion in 2010

4

  • Annual turnover of MNOK 8,598
  • 18 % increase since last year

Revenues 4,226 6,226 7,309 8,598 Domestic revenue 1,792 2,295 2,900 3,316

% y.o.y. chg 22 % 28 % 26 % 14 %

International revenue 2,435 3,932 4,410 5,282

% y.o.y. chg 66 % 61 % 12 % 20 %

slide-3
SLIDE 3

MNOK 170 ash losses canceled by MNOK 180 SAS compensation

Full year operating profit of MNOK 210

– EBITDAR MNOK + 1,175

(+ 1,341)

– EBITDA MNOK + 397

(+ 721)

– Operating profit (EBIT) MNOK + 210

(+ 572) .

– Pre-tax profit (EBT) MNOK + 243

(+ 623)

– Net profit MNOK + 189

(+ 446)

Slide: 5

EBIT (full year) EBITDAR (full year)

2007 2008 2009 2010 EBITDAR margin 12 % 3 % 18 % 14 % 2007 2008 2009 2010 EBIT/ operating margin 3 %

  • 5 %

8 % 2 %

Cash and cash equivalents of 1.2 billion

6

  • Cash flows from operations in Q4 2010

MNOK +158 (+353)

– Tax payable MNOK 110 (FS 2009) – MNOK +188 (+452) improved collection of receivables – Includes MNOK 180 compensation from SAS

  • Cash flows from investing activities in Q4 2010

MNOK -450 (-372)

– Aircraft delivery and pre-delivery-payments for future deliveries

  • Cash flows from financing activities in Q4 2010

MNOK +289 (+646)

  • Cash and cash equivalents at period-end

MNOK +1,178 (+1,409)

slide-4
SLIDE 4
  • !

!

  • !"# !
  • $

$ %!"" &$ $'& $'& ! "

  • "#"$%

&'!!! &( ' &( '

Group equity improved by MNOK 198 compared to last year

  • Equity unchanged at NOK 1.8 billion at the end of the fourth

quarter compared the beginning of the period.

  • Group equity ratio of 27 % (32 %)

Slide: 7 Slide: 7

Production growth of 31 % in 2010

  • 77 % load factor in 2010 – down one percentage point from last year

– 12 brand new Boeing 737-800s can seat 38 more passengers at no additional cost

– The number of passengers per flight has increased

Slide: 8 Slide: 8

ASK 7,560 11,530 13,555 17,804 Load Factor 80 % 79 % 78 % 77 %

slide-5
SLIDE 5

13 million passengers in 2010

Slide: 9

  • An increase of 2.3 million passengers (+21 %)

Slide: 9

Passengers (million) 6.9 9.1 10.8 13.0

Norwegian with continued strong growth at Oslo Airport

38 % of all passengers traveled with Norwegian in 2010

  • + 5 % in 2010

Slide: 10

Oslo airport (OSL) – all airlines Oslo airport (OSL) – only Norwegian

  • + 14 % in 2010

Slide: 10

  • Increase of 920,000 passengers at Oslo Airport in 2010
  • Norwegian contributed with 96 % of the growth
slide-6
SLIDE 6

Stronger foothold in domestic and international markets in Q4

Oslo (Home Base) Stockholm (Developing Base) Copenhagen (Developing Base)

  • Growth allocated to Finland, Sweden and Denmark going forward

Slide: 12

Launch of Helsinki base New Stockholm – Malmö & Gothenburg routes

  • Two largest Swedish domestic routes
  • 3 daily rotations
  • 6 daily to MMX from spring 11
  • 3 aircraft based in Helsinki starting March 2011
  • 2 domestic destinations

– Oulu and Rovaniemi

  • 11 international destinations

– Oslo and Stockholm already in operation – Copenhagen, London (Gatwick), Rome, Split, Alicante, Barcelona, Malaga, Nice and Crete (Chania)

Overall

  • 126 new weekly departures spring 2011
  • 170 weekly flights to and from London (+ 33 %)
  • “Inheriting” Transavia’s pax in Copenhagen
slide-7
SLIDE 7

Unit cost excl. fuel down 10 % in 2010

  • Unit cost of 0.46 in 2010 - down 5 %

Slide: 13 Slide: 13

Cost per ASK (CASK) (NOK) 0.53 0.56 0.49 0.46 CASK excl. fuel (NOK) 0.40 0.37 0.38 0.34

Continuous delivery stream of 737-800s will drive down the unit cost further

Norwegian aiming for cost leadership at primary airports

14

!""#$"" %&'" ( ")" !"*"+" !"#$%&'("( $)$*++,*+-+. /0.1.1. 2)3 $ .$ 0)/4.1.1.4.*++, *++, 056.. .05*+-+738++* 2 .7...$3

slide-8
SLIDE 8

Large potential for additional cost reductions with Long Haul operations

15

!"#$%&'("( $)$*++,*+-+. /0.1.1. 2)3 $ .$ 0)/4.1.1.4.*++, *++, 056.. .05*+-+738++* 2 .7...$3 !""#$"" %&'" ( ")" !"*"+"

Continued growth in ancillary revenue

Slide: 16 Slide: 16

  • Ancillary revenue comprises 12 % of 2010 revenues
  • Goal of 15 % of total revenues

Ancillary revenue/ pax 33 51 73 79

slide-9
SLIDE 9

Current planned fleet development

17

  • Average Norwegian aircraft 4 years newer compared to last year

– Average fleet age currently 7.6 years

  • Q1 deliveries:

– January: 1 – February: 2 – March: 4

  • Fleet wide 737-800 installation by 2012
  • 20 aircraft in 2011
  • Free trial period
  • Future source of ancillary revenue
  • Will enhance offering to business travelers
  • Based on the “Dreamliner” interiors
  • Significantly larger overhead bins
  • Seats with industry leading legroom
  • LED “mood” lightning
  • 2 dB reduction of cabin noise

Product Enhancements

18

Boeing SKY On Board WiFi

slide-10
SLIDE 10
  • Business environment

– Uncertain business climate – Seasonal fluctuations – Strong competition

  • Production

– The company expects a production growth (ASK) of approximately 20 – 25 % – Primarily from increasing the fleet by adding 737-800’s – Capacity deployment depending on development in the overall economy and marketplace

  • Cost development

– Unit cost expected in the area of 0.46 (including current hedges)

  • Fuel price dependent – USD 850 pr. ton (excluding hedged volumes)
  • Currency dependent – USD/NOK 6.00 (excluding hedged volumes)
  • Based on the current route portfolio
  • Larger share of aircraft with more capacity and lower unit cost

Expectations for 2011

Slide: 19 Slide: 19

Norwegian offers 244 scheduled routes to 97 destinations

slide-11
SLIDE 11

Norwegian Air Shuttle ASA

Mailing address P.O. Box 113 No – 1330 Fornebu Visiting address Oksenøyveien 3 Telephone +47 67 59 30 00 Telefax +47 67 59 30 01 Internet www.norwegian.com Organization number NO 965 920 358 MVA

Slide: 21