
SLIDE 1
Norwegian Air Shuttle ASA
Q3 2010 Presentation Q3 2010 Presentation October 21st 2010
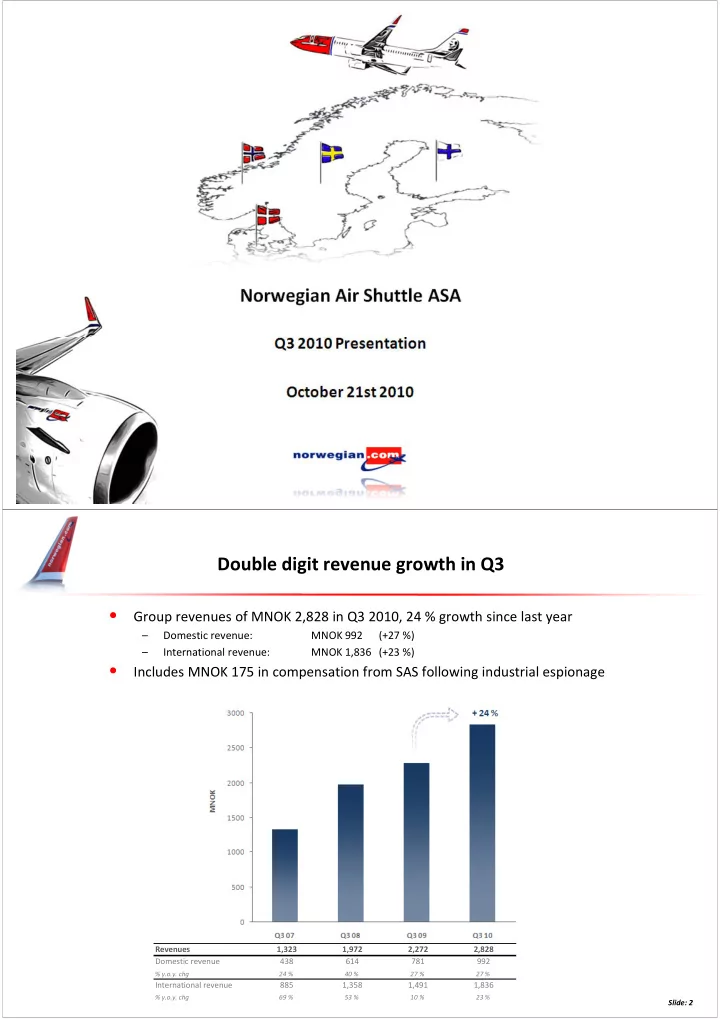
Double digit revenue growth in Q3
- Group revenues of MNOK 2,828 in Q3 2010, 24 % growth since last year
– Domestic revenue: MNOK 992 (+27 %) – International revenue: MNOK 1,836 (+23 %)
- Includes MNOK 175 in compensation from SAS following industrial espionage
Revenues 1,323 1,972 2,272 2,828 Domestic revenue 438 614 781 992
% y.o.y. chg 24 % 40 % 27 % 27 %
International revenue 885 1,358 1,491 1,836
% y.o.y. chg 69 % 53 % 10 % 23 %
Slide: 2