
SLIDE 1
1
Norwegian Air Shuttle ASA
Q3 2012 Presentation October 25th 2012 CEO Bjørn Kjos
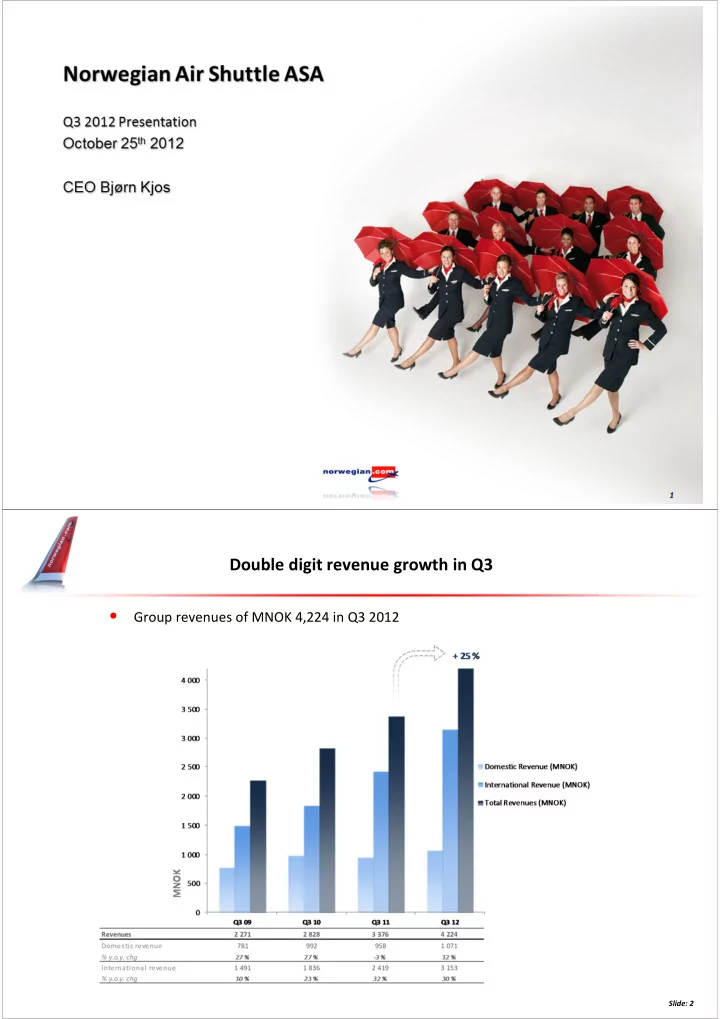
Double digit revenue growth in Q3
- Group revenues of MNOK 4,224 in Q3 2012
Slide: 2
Norwegian Air Shuttle ASA Q3 2012 Presentation October 25 th 2012 - - PDF document
Norwegian Air Shuttle ASA Q3 2012 Presentation October 25 th 2012 CEO Bjrn Kjos 1 Double digit revenue growth in Q3 Group revenues of MNOK 4,224 in Q3 2012 Slide: 2 Pre-tax profit improved by 187 million EBITDAR MNOK 1 098 1 206
1
Slide: 2
EBITDAR MNOK 1 098
1 206
EBITDA MNOK 822
1 001
EBIT MNOK 708
923
Pre-tax profit (EBT) MNOK 873
686
Net profit MNOK 628
495
Slide: 3
4
(MNOK 243) (MNOK -801) (MNOK 768) (MNOK 1430)
5
1 430 Cash 1,735 1 577 Receivables 1,562 1 892 Aircraft prepayments 2,099 4 143 Non-current assets 7,611
2 000 4 000 6 000 8 000 10 000 Q3 11 Q3 12
MNOK
Equity 2,379 2 059 Pre-sold tickets 1,763 1 354 Other current liabilities 2,312 2 063 Long term liabilities 4,454 3 565
Q3 12 Q3 11
Slide: 6 Slide: 6
Slide: 7 Slide: 7
ASK 331 683 1 033 1 694 2 333 3 590 3 979 5 331 6 480 7 780 Load Factor 67 % 69 % 86 % 85 % 86 % 82 % 82 % 80 % 84 % 82 % 67 % 69 % 86 % 85 % 86 % 82 % 82 % 80 % 84 % 82 %
0 % 20 % 40 % 60 % 80 % 100 % 1 000 2 000 3 000 4 000 5 000 6 000 7 000 8 000
Q3 03 Q3 04 Q3 05 Q3 06 Q3 07 Q3 08 Q3 09 Q3 10 Q3 11 Q3 12
Load Factor Available Seat KM (ASK)
ASK Load Factor
+ 20 %
Pax (mill) 0.3 0.5 0.9 1.5 2.0 2.6 3.1 3.8 4.6 5.2
0.00 1.00 2.00 3.00 4.00 5.00
Q3 03 Q3 04 Q3 05 Q3 06 Q3 07 Q3 08 Q3 09 Q3 10 Q3 11 Q3 12
Passengers (million)
+ 13 %
Slide: 8 Slide: 8
9
10
Sources: Avinor, Swedavia, Copenhagen Airports, Finavia, Gatwick Airport, Aena
12
Cost per ASK (CASK) (NOK) CASK ex. fuel 0.32 0.44 0.41 0.28 0.40 0.30 0.41 0.27
0.32 0.30 0.27 0.28
0.12 0.11 0.15 0.14 0.25 0.30 0.35 0.40 0.45 Q2 09 Q2 10 Q2 11 Q2 12
Operating cost EBITDA level per ASK (CASK)
Slide: 13 Slide: 13
– 3 % higher NOK denominated fuel price – USD/NOK up 7 % y.o.y. (maintenance, fuel & leasing)
Norwegian hedges USD/NOK to counter foreign currency risk exposure on USD denominated borrowings translated to the prevailing currency rate at each balance sheet date. Hedge gains and losses are according to IFRS recognized under operating expenses while foreign currency gains and losses from translation of USD denominated borrowings are recognized under financial items and is thus not included in the CASK concept. Hedge effects offset under financial items have not been included in this graph.
14
15
16
CDP Methodology and why Norwegian won’t participate:
A nice, thick and glossy report doesn't necessarily imply environmental progressiveness.
starting point
a high score this year.
questions answered, the higher the score
report), the higher the score in CDP.
Sources: SAS Group Sustainability Report 2011 (Blue1 & Scandinavian Airlines), Malmö Aviation “We care about the environment” report, Air Berlin Annual Report 2011, easyJet Annual Report 2011, Ryanair Annual Report 2012 & Norwegian’s own calculations.
17
18
unforeseen one-offs
Slide: 19 Slide: 19
Slide: 20 Slide: 20
22