
SLIDE 1
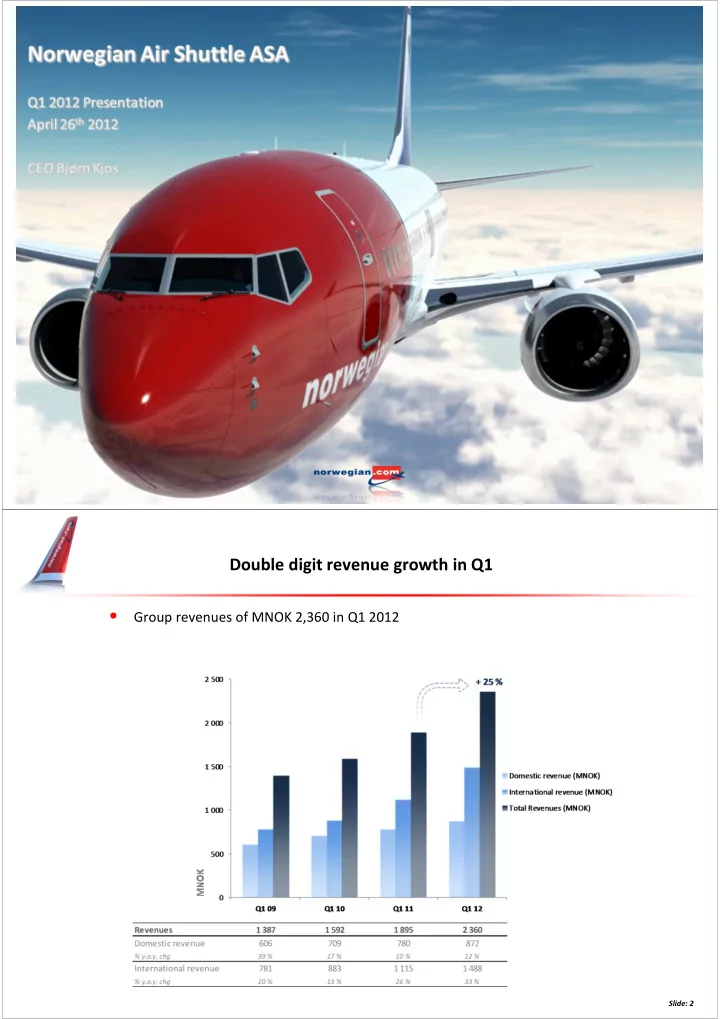
Double digit revenue growth in Q1
- Group revenues of MNOK 2,360 in Q1 2012
Slide: 2
Group revenues of MNOK 2,360 in Q1 2012 Slide: 2 Seasonally slow - - PDF document
Double digit revenue growth in Q1 Group revenues of MNOK 2,360 in Q1 2012 Slide: 2 Seasonally slow Q1 affected by soaring oil price EBITDAR MNOK - 252 (-230) EBITDA MNOK - 497 (-430) EBIT MNOK - 575 (-495) .
Slide: 2
(-230)
(-430)
(-495) .
(-406)
(-293)
Slide: 3
115 33 16 100
25 Result improvement MNOK 47
100
Q1 2012 Acutal Fuel Price increase More efficient aircraft reduce consumption Provisions re-delivery 737-300 Wet Lease Underlying Q1 2012 Underlying Q1 2011 Expansion (SE, DK, FI) Q1 2011 Actual
EBT (MNOK)
4
5
1 229 Cash 1,487 1 260 Receivables 1,552 4 630 Non-current assets 6,646
1 000 2 000 3 000 4 000 5 000 6 000 7 000 8 000 9 000 10 000 Q1 11 Q1 12
MNOK
Equity 1,661 1 506 Pre-sold tickets 2,291 1 822 Other current liabilities 3,527 1 359 Long term liabilities 3,207 2 433
Q1 12 Q1 11
Slide: 6 Slide: 6
Slide: 7 Slide: 7 ASK
208 370 569 933 1 342 2 183 2 674 3 507 4 498 5 266
Load Factor
44 % 65 % 68 % 77 % 75 % 77 % 75 % 75 % 74 % 77 % 44 % 65 % 68 % 77 % 75 % 77 % 75 % 75 % 74 % 77 %
0 % 20 % 40 % 60 % 80 % 100 % 1 000 2 000 3 000 4 000 5 000
Q1 03 Q1 04 Q1 05 Q1 06 Q1 07 Q1 08 Q1 09 Q1 10 Q1 11 Q1 12
Load Factor Available Seat KM (ASK)
ASK Load Factor
+ 17 %
Slide: 8 Slide: 8 Pax (mill)
0.2 0.4 0.6 1.0 1.3 2.0 2.1 2.7 3.1 3.6
0.0 1.0 2.0 3.0 4.0
Q1 03 Q1 04 Q1 05 Q1 06 Q1 07 Q1 08 Q1 09 Q1 10 Q1 11 Q1 12
Passengers (million)
+ 19 %
27 % 39 % 8 % 16 % 4 % n/a 29 % 45 % 9 % 15 % 8 % 20 % 30 % 44 % 13 % 17 % 10 % 19 % 29 % 43 % 16 % 22 % 11 % 20 %
0 % 10 % 20 % 30 % 40 % 50 % International From Oslo Airport (OSL) Domestic From Oslo Airport (OSL) International From Stockholm Airport (ARN) Domestic From Stockholm Airport (ARN) International From Copenhagen Airport (CPH) Domestic From Copenhagen Airport (CPH)
Market Share Norwegian (Q1) + 31,000 pax + 52,000 pax + 116,000 pax + 116,000 pax + 97,000 pax
10
Slide: 11 Slide: 11
Cost per ASK (CASK) (NOK) 0.56 0.51 0.50 0.51 CASK ex. fuel 0.45 0.40 0.37 0.36
0.45 0.40 0.37 0.36
0.11 0.11 0.13 0.15 0.30 0.35 0.40 0.45 0.50 0.55 0.60 Q1 09 Q1 10 Q1 11 Q1 12
Operating cost EBITDA level per ASK (CASK)
Fuel share of CASK CASK excl fuel
Norwegian hedges USD/NOK to counter foreign currency risk exposure on USD denominated borrowings translated to the prevailing currency rate at each balance sheet date. Hedge gains and losses are according to IFRS recognized under operating expenses while foreign currency gains and losses from translation of USD denominated borrowings are recognized under financial items and is thus not included in the CASK concept. Hedge effects offset under financial items have not been included in this graph.
12
Sources: SAS Group Annual Report 2011, Finnair Plc. year-end report 2011 and Annual Report 2010, Ryanair Annual Report 2011, easyJet Annual Report 2011, Air Berlin Annual Report 2011 and Norwegian’s estimations
Ancillary revenue/ scheduled pax 70 80 86 84 Ancillary revenue/ all pax (inc. charter) 70 80 84 82 10 20 30 40 50 60 70 80 90 Q1 09 Q1 10 Q1 11 Q1 12
Ancillary revenue per passenger (NOK)
Slide: 13 Slide: 13
14
Slide: 16 Slide: 16
Slide: 18