norwegian air shuttle asa
play

Norwegian Air Shuttle ASA Q2 2011 presentation July 14th 2011 - PDF document

Norwegian Air Shuttle ASA Q2 2011 presentation July 14th 2011 Double digit revenue growth in Q2 Group revenues of MNOK 2,725 in Q2 2011, 34 % growth since last year Domestic revenue: MNOK 982 (+28 %) International revenue:


  1. Norwegian Air Shuttle ASA Q2 2011 presentation July 14th 2011 Double digit revenue growth in Q2 • Group revenues of MNOK 2,725 in Q2 2011, 34 % growth since last year – Domestic revenue: MNOK 982 (+28 %) – International revenue: MNOK 1,743 (+38 %) Slide: 2

  2. Q2 operating result improved by 185 million from last year Soaring fuel price slows positive momentum – EBITDAR MNOK + 347 (+144) – EBITDA MNOK + 137 (-49) – EBIT MNOK + 73 (- 93) . – Pre-tax profit (EBT) MNOK + 75 (- 188) – Net profit MNOK + 54 (- 134) EBITDAR development Q2 EBITDA development Q2 Slide: 3 Underlying EBITDA improvement of MNOK 333 • Underlying MNOK 333 improvement • Fuel price up 48 % since last year – equivalent to MNOK 193 • USD hedges designed to counter balance sheet agio/disagio from USD liabilities • MNOK 55 hedge effect neutralized by agio under financial items 400 385 55 350 300 250 193 200 333 150 EBITDA (MNOK) 100 137 50 100 0 -49 -50 Q2 2011 Fuel Price B/S hedge effect Underlying Q2 2010 Direct cost from Y.o.y underlying Acutal increase offset by agio Q2 2011 Actual closure of result European improvement airspace (2010) 4

  3. Cash and cash equivalents of 1.2 billion • Cash flows from operations in Q2 2011 MNOK +275 (+311) – Last year with positive one-off from faster collection of receivables • Cash flows from investing activities in Q2 2011 MNOK -756 (-558) – Aircraft deliveries and pre-delivery-payments for future deliveries – Sale & Leaseback • Cash flows from financing activities in Q2 2011 MNOK +471 (+201) – PEFCO aircraft long term financing – Principal repayments • Cash and cash equivalents at period-end MNOK +1,219 (+1,581) 5 Group equity improved by MNOK 294 compared to last year • Total balance of NOK 8.0 billion • Equity of NOK 1.6 billion at the end of the second quarter • Group equity ratio of 20 % (20 %) – Equity ratio seasonal: Strong pre-sales and lower earnings during H1, High earnings and lower pre-sales in H2 8,000 Long term 7,000 liabilities 2,854 6,000 1,538 Non-current assets 5,310 5,000 Other 3,699 current liabilities 4,000 2,045 1,602 3,000 Pre-sold tickets 1,953 1,107 1,535 Receivables 2,000 1,443 1,000 Equity MNOK 1,581 Cash 1,268 1,562 1,219 0 Q2 10 Q2 11 Q2 11 Q2 10 Slide: 6 Slide: 6

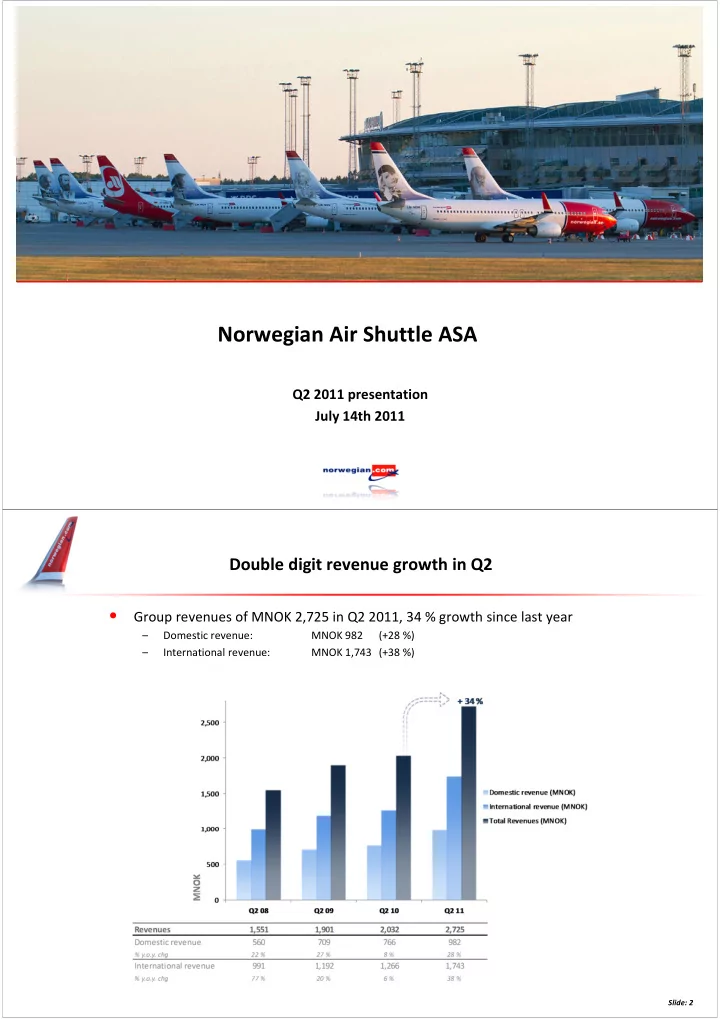
  4. Production growth of 24 % in Q2 • 78 % load factor in Q2 • Load up 3 p.p. from last year – Up 2 p.p. adjusted for last year’s closure of European airspace 6,000 5,000 100 % 100 % + 24 % + 28 % 5,000 78 % 78 % 78 % 77 % 4,000 75 % 80 % 80 % 75 % 75 % 74 % 4,000 3,000 60 % 60 % ASK ASK 3,000 Load Factor Load Factor 2,000 40 % 40 % Available Seat KM (ASK) Available Seat KM (ASK) 2,000 1,000 20 % 20 % 1,000 Load Factor Load Factor 0 0 0 % 0 % Q2 08 Q1 08 Q2 09 Q1 09 Q2 10 Q1 10 Q2 11 Q1 11 ASK ASK 2,182 2,974 2,674 3,469 4,449 3,507 5,518 4,498 Load Factor Load Factor 78 % 77 % 75 % 78 % 75 % 75 % 74 % 78 % Slide: 7 Slide: 7 Passenger record: More than 4.0 million passengers in Q2 • 26 % growth from last year • An increase of 840,000 passengers – Increase of 540,000 adjusted for last year’s closure of European airspace 4.5 + 26 % 4.0 3.5 3.0 2.5 2.0 1.5 Passengers (million) 1.0 0.5 0.0 Q2 08 Q2 09 Q2 10 Q2 11 Passengers (million) 2.3 2.8 3.2 4.0 Slide: 8 Slide: 8

  5. Growth focus on Sweden and Helsinki in Q2: Recently established Helsinki base with 260,000 passengers in Q2 Norwegian in Oslo Norwegian in Stockholm Norwegian in Copenhagen + 326,000 pax + 331,000 pax + 107,000 pax • Marginal increase in domestic frequencies • New dom. routes to Malmö & Gothenburg • International production growth • Growth due to larger aircraft and charter • Substantial international production growth Underlying unit cost down 6.5 % • Unit cost 0.47 in Q2 – Unchanged from last year in spite of 48 % higher fuel price (34 % denominated in NOK) • Unit cost excl. fuel 0.32 – Down 6 % from last year (adjusted for one-offs) – Only marginally longer stage length of 2 % 0.55 0.50 Operating cost EBITDA level per ASK (CASK) 0.45 0.18 0.09 Fuel share of CASK 0.12 CASK excl fuel 0.40 0.15 0.35 - 6.5 % 0.38 0.36 0.34 - 0.32 0.30 Q2 08 Q2 09 Q2 10 Q2 11 Cost per ASK (CASK) (NOK) 0.54 0.47 0.47 0.47 CASK excl. fuel 0.36 0.38 0.34 0.32 Slide: 10 Slide: 10

  6. Norwegian aiming for CASK NOK 0.30 excluding fuel Scale economies Scale economies New more efficient aircraft New more efficient aircraft Growth adapted to int’l markets Growth adapted to int’l markets • Uniform fleet of Boeing 737-800s • Flying cost of 737-800 lower than 737-300 • Salaries adapted to international cost levels • Overheads • 737-800 has 38 “free” seats • Outsourcing/ Off-shoring • 7 % lower unit fuel consumption in Q2 • 205 employees in the Baltics (admin and ops) Crew and aircraft utilization Crew and aircraft utilization Optimized average stage length Optimized average stage length Automation Automation • Self check-in/ bag drop • Rostering and aircraft slings optimized • Fixed costs divided by more ASKs • Automated charter & group bookings • Q2 utilization from 10.7 to 11.0 BLH pr a/c • Frequency based costs divided by more ASKs • Streamlined operative systems & processes • Q2 stage length up by 2 % 11 Increasing fuel efficiency saves Norwegian MNOK 55 and the environment 30,000 tons of CO 2 in Q2 alone • 7 % lower consumption per passenger per kilometer in Q2 • Norwegian among the most efficient (and greenest) carriers Norwegian with substantial efficiency leaps Efficiency and environmental progressiveness to improve further ��������� ����������������������������������������������������������������������������������� ������������������������������� ��� ������������������ ������������������!�"���#��������$�����%���&� � ��������� ������������������������������������������������������������������������������������������������������������������ � ������������������������������������� ���������������������������������!������"#"$%��� 12 � &���������������������������������������'(��������������������������)* �� �����'(��������������������+���,$ �-�������)* �� ����������#� .���������������������� ��.��������������(/����0��������������������������+���,$ �-���

  7. Ancillary revenues remains a significant contributor • Ancillary revenue comprises 11 % of Q2 revenues (target 15 %) + 3 % 80 70 60 50 Ancillary revenue per passenger (NOK) 40 30 20 10 0 Q2 08 Q2 09 Q2 10 Q2 11 Ancillary revenue/ pax 42 68 76 78 Slide: 13 Slide: 13 Current planned fleet development • 59 aircraft in the fleet at end of Q2 – 737-800: 42 (increase of 18 since last year) – 737-300: 17 (decrease of 11 since last year) • 3 new 737-800 deliveries in H2 14

  8. Aircraft financing through 2012 secured • PDP and LT financing secured throughout 2012 in recent NOK 3 billion mandate – PDP tranche closed – Long Term 2011 tranche closed – Long Term 2012 tranche expected closed in July/ August 2011 • Committed fleet of 51 new 737-800s by year-end 2012 (DY Spec) – On-balance-sheet: 25 – Sale & Leaseback: 8 – Operational leases (new): 18 ��������� ������% Facsimile from capital markets day presentation May 2011 15 Expectations for 2011 • Business environment – Uncertain business climate – Seasonal fluctuations – Continued but stabilized yield pressure • Production – The company expects a production growth (ASK) of approximately 25 % – Primarily from increasing the fleet by adding 737-800’s – Capacity deployment depending on development in the overall economy and marketplace • Cost development – Unit cost expected in the area of 0.46 (including current hedges) • Fuel price dependent – USD 850 pr. ton (excluding hedged volumes) • Currency dependent – USD/NOK 6.00 (excluding hedged volumes) • Based on the current route portfolio • Larger share of aircraft with more capacity and lower unit cost Slide: 16 Slide: 16

  9. Norwegian offers 261 scheduled routes to 100 destinations Norwegian Air Shuttle ASA Mailing address P.O. Box 113 No – 1330 Fornebu Visiting address Oksenøyveien 3 Telephone +47 67 59 30 00 Telefax +47 67 59 30 01 Internet www.norwegian.com Organization number NO 965 920 358 MVA Slide: 18

Download Presentation
Download Policy: The content available on the website is offered to you 'AS IS' for your personal information and use only. It cannot be commercialized, licensed, or distributed on other websites without prior consent from the author. To download a presentation, simply click this link. If you encounter any difficulties during the download process, it's possible that the publisher has removed the file from their server.

Recommend


More recommend