
SLIDE 1
DEVONSHIRE COUNTY SANITATION DISTRICT HARBOR INDUSTRIAL SEWER - - PowerPoint PPT Presentation
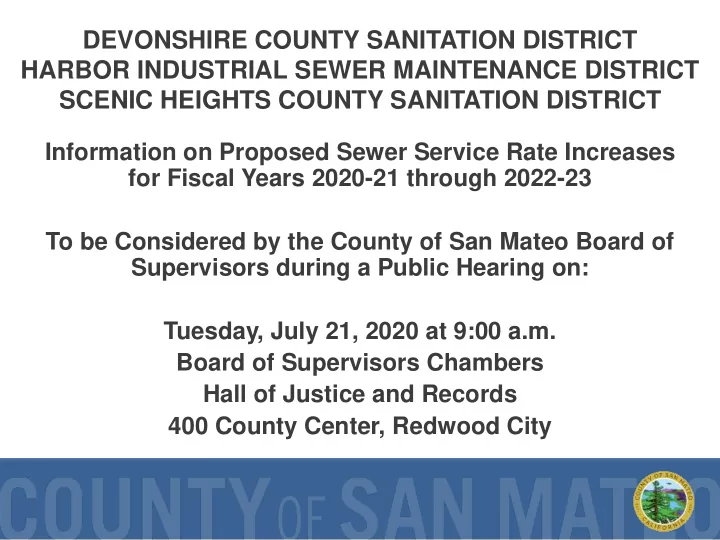
DEVONSHIRE COUNTY SANITATION DISTRICT HARBOR INDUSTRIAL SEWER MAINTENANCE DISTRICT SCENIC HEIGHTS COUNTY SANITATION DISTRICT Information on Proposed Sewer Service Rate Increases for Fiscal Years 2020-21 through 2022-23 To be Considered by the
District Boundary Redwood Shores San Carlos Foster City Belmont San Mateo
District Boundary Redwood Shores San Carlos Redwood City Belmont Foster City
Redwood Shores
San Carlos Redwood City District Boundary
Image Source: Pixel-Gym
Source: City of San Mateo Clean Water Program.
District Age (Years) * Number of Connections ** Equivalent Residential Units (ERU) Downstream Transport Agency Treatment Facility Devonshire CSD 64 276 301 City of San Carlos Silicon Valley Clean Water (SVCW) Harbor Industrial SMD 69 63 233 Scenic Heights CSD 71 54 57
Devonshire CSD
Harbor Industrial SMD
Scenic Heights CSD
* Age based on District formation date ** Based on 2019-20 Sewer Service Charge Report
General County Tax 28.80% Free Library 4.20% County Fire 7.81% San Carlos Elem School 22.56% SU High School 18.98% San Mateo Jr. College 8.24%
DCSD 2.44%
Air Quality Mangmnt 0.25% County Harbor District 0.43% Mosquito Abatement 0.23% Sequoia Hospital Dist 1.78% County Education Tax 4.29%
Note: DCSD allocation of a portion (2.44%) of the property tax is approximately $34,700 per year
General County Tax 24.41% Free Library 3.56% Belmont Elem School 21.20% SU High School 16.08% SM Junior College 6.98% Belmont Fire Dist 17.10% Belmont Fire Zone 1 1.33%
Harbor Industrial Sewer 0.96%
Belmont County Water 0.57% Mid Pen ROSD 1.89% Air Quality Mngmnt 0.22% County Harbor District 0.36% Mosquito Abatement 0.20% Sequoia Hospital Dist 1.51% County Education Tax 3.63%
Note: HISMD allocation of a portion (0.96%) of the property tax is approximately $10,000 per year.
General County Tax 26.97% Free Library 3.93% County Fire Protection 7.31% RWC Elem School 26.89% SU High School 17.77% SM Jr College 7.72%
Scenic Heights CSD 0.79%
Mid Pen ROSD 2.09% Air Quality Mngmnt 0.24% County Harbor District 0.40% Mosquito Abatement 0.22% Sequoia Hospital Dist 1.67% County Education Tax 4.02%
Note: SHCSD allocation of a portion (0.79%) of the property tax is approximately $1,400 per year
* Revenue may include: property taxes, interest, HOPTR, Sewer Service Charges, miscellaneous fees.
$101,654 $116,442 $112,374 $116,917 $210,122 $126,563 $31,443 $248,181 $329,000 $295,241 $308,526 $322,410 $336,918 $352,080 $367,923 $489,194 $511,253 $522,579 $533,135 $546,920 $547,982
$1,073,755 $1,134,611 $972,716 $731,511 $810,811 $795,529
$0 $200,000 $400,000 $600,000 $800,000 $1,000,000 $1,200,000 $0 $200,000 $400,000 $600,000 $800,000 $1,000,000 $1,200,000 2018-19 Actual 2019-20 Estimated 2020-21 Estimated 2021-22 Estimated 2022-23 Estimated 2023-24 Estimated
O&M and Regulations District CIP Transport & Treatment Revenue* (w/ proposed and estimated future rate increases) Fund Balance (Beg. FY)
* Revenue may include: property taxes, interest, HOPTR, Sewer Service Charges, miscellaneous fees.
$55,985 $50,432 $52,209 $54,294 $56,464 $58,648 $29,892 $289,695 $248,000 $248,000 $51,299 $55,224 $57,420 $59,580 $61,920 $61,920 $151,146 $158,929 $161,452 $166,838 $172,242 $173,152
$945,037 $959,006 $722,584 $526,407 $331,371 $385,229
$0 $200,000 $400,000 $600,000 $800,000 $1,000,000 $1,200,000 $0 $200,000 $400,000 $600,000 $800,000 $1,000,000 $1,200,000 2018-19 Actual 2019-20 Estimated 2020-21 Estimated 2021-22 Estimated 2022-23 Estimated 2023-24 Estimated
O&M and Regulations District CIP Transport & Treatment Revenue* (w/ proposed and estimated future rate increases) Fund Balance (Beg. FY)
$28,718 $28,383 $28,932 $30,098 $97,437 $32,583 $8,019 $26,294 $53,937 $56,364 $58,901 $61,551 $64,321 $67,537 $99,420 $111,665 $117,421 $123,467 $129,537 $129,268
$107,667 $116,413 $117,037 $146,625 $178,443 $146,222
$0 $20,000 $40,000 $60,000 $80,000 $100,000 $120,000 $140,000 $160,000 $180,000 $0 $20,000 $40,000 $60,000 $80,000 $100,000 $120,000 $140,000 $160,000 $180,000 2018-19 Actual 2019-20 Estimated 2020-21 Estimated 2021-22 Estimated 2022-23 Estimated 2023-24 Estimated
O&M and Regulations District CIP Transport & Treatment Revenue* (w/ proposed and estimated future rate increases) Fund Balance (Beg. FY)
(+ $40/yr or $3.33/mo)
(+ $40/yr or $3.33/mo)
(+ $40/yr or $3.33/mo)
(+ $30/yr or $2.50/mo)
(+ $30/yr or $2.50/mo)
(+ $30/yr or $2.50/mo)
(+ $100/yr or $8.33/mo)
(+ $100/yr or $8.33/mo)
(+ $100/yr or $8.33/mo)