
SLIDE 1
Cost of Ginning Cotton – 2016 Survey Results
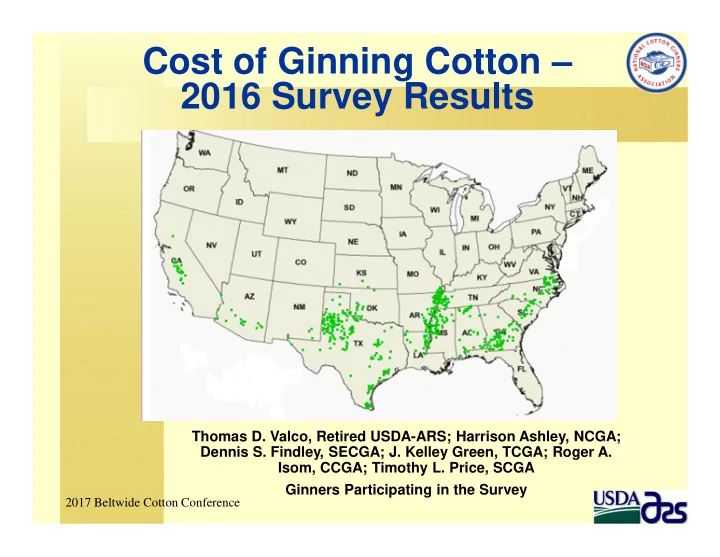
Thomas D. Valco, Retired USDA-ARS; Harrison Ashley, NCGA; Dennis S. Findley, SECGA; J. Kelley Green, TCGA; Roger A. Isom, CCGA; Timothy L. Price, SCGA Ginners Participating in the Survey
2017 Beltwide Cotton Conference