Company Information US $ 5.0 billion integration BPO services - - PDF document

company information
SMART_READER_LITE
LIVE PREVIEW

Company Information US $ 5.0 billion integration BPO services - - PDF document

2 Contents Operational Excellence with a human face applying production and psychological theories in the back office HCL a and P P r ocess : ss : A A S S napsh shot Cl i ent p prob oblem a and ou our s solution on w with B


slide-1
SLIDE 1

1

1

2

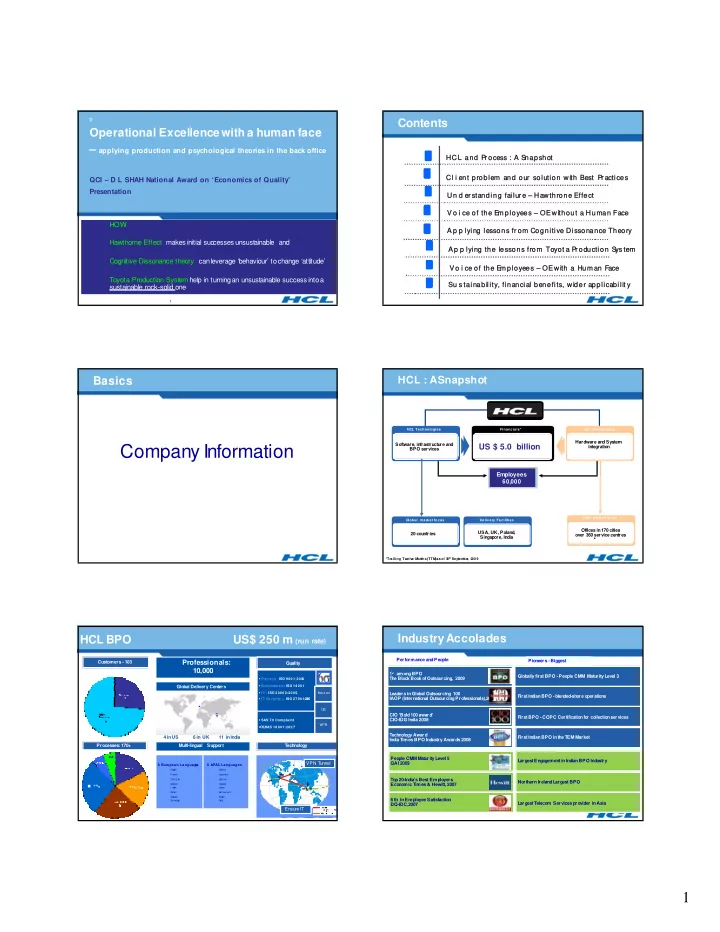
Operational Excellence with a human face – applying production and psychological theories in the back office

QCI – D L SHAH National Award on ‘Economics of Quality’ Presentation HOW Hawthorne Effect makes initial suc cesses unsustainable and Cognitive Dissonance theory can leverage ‘behaviour’ to change ‘attitude’ Toyota Production System help in turning an unsustainable success into a sustainable rock-solid one Cl i ent p prob

  • blem a

and ou

  • ur s

solution

  • n w

with B Best P P r actices HCL a and P P r ocess : ss : A A S S napsh shot V o i ce o e of t the E e E m ployee ees – – OE w without a H a Human Face A p p lying le lessons ns f fr om C Cognit gnitiv ive D Dissonanc nce T Theory Un d er stand nding f ing failu ilur e – – Hawthrone ne E Effect

Contents

V o i ce o e of t the E e E m ployee ees – – OE w with a a H Hum an F Face Su s tainabilit lity, f fina nanc ncia ial b l bene nefits, w wider a applic licabili ilit y A p p lying t the l lessons f from

  • m T

Toyot a P P r od

  • duction
  • n S

S ys tem

Basics

Company Information

HCL : A Snapshot

*Trailing Twelv e M

  • n

ths (TTM ) as

  • f 3

0 t

h Sep

tem be r, 2 009

20 countries USA, UK, Poland, Singapore, India

Employees 60,000

HCL Technologies Financials* Global market focus Delivery Facilities

US $ 5.0 billion

Offices in 170 cities

  • ver 360 service centres

HCL Infosystems India market focus

Software, infrastructure and BPO services Hardware and System integration

HCL BPO US$ 250 m (run rate)

Processes: 170+ Customers - 103

Professionals: 10,000

8 European Languag e s

E ngl i sh Fr ench G er m an S pani sh I t al i an D ani sh S w edi sh N

  • r w

egi an

Multi-lingual Support Quality

Process ISO 9001:200 Environment ISO 14001 IT - ISO 20000:2005 , IT Security – ISO 27001 :2 5

Technology Global Delivery Centers 4 in US 6 in UK 11 in India

8 APAC Languages

C hi nese Japanese H ebr ew Tagol

  • g

Japan V i et nam ese E ngl i sh H i ndi

Ensure IT Quality

SAS 70 Complaint OSHAS 18001:2007 Kaiz en OE BPR

VPN Tunnel

Industry Accolades

1st among BPO The Black Book of Outsourcing, 2009 Performance and People Leaders in Global Outsourcing 100 IAOP (International Outsourcing Professionals),2008 CIO ’Bold 100 award’ CIO-IDG India 2008 Technology Award India Times BPO Industry Awards 2008 People CMM Maturity Level 5 QAI 2009 Top 20-India’s Best Employers Economic Times & Hewitt, 2007 6 th in Employee Satisfaction DQ-IDC,2007 Globally first BPO - People CMM Maturity Level 3 First Indian BPO - blended-shore operations First BPO - COPC Certification for collection services First Indian BPO in the TEM Market Pioneers - Biggest Largest Engagement in Indian BPO Industry Northern Ireland Largest BPO Largest Telecom Services provider in Asia

slide-2
SLIDE 2

2

Basics

Process

Background information

Converting a Purchase Order into a Sales Order

Product Customer Logistics Price Date Basic

M FG SO Sales Customer PO PO TO SO

Legacy system

No GUI

2500 12,000 50,000 Customers Orders Line Items 100,000 prod ucts 200+ factorie s 160 + countrie s

40 parameters

in an unambiguous Sales Order from Purchase Order from Client masters, Contracts Seller code Facility Ship complete Received date Account code UOM Ship to code Route Ship exact Entered date Desk code Conversion factor Sold to code Via Special instructions Promise date SO number Units in inner pack Charge to code Export marks Expedite date PO type Inner pack in outer pack Domestic Delivery Agent Contact number Expedite flag Pack type Future date Load slip Product Customer Logistics Price Date Basic Product Ship to Price PO date PO number Buyer code Sold to INCO terms Request date Quantity Charge to Payment terms Cancel date

M FG SO Sales Cus tom er PO PO TO SO 2500 12,000 50,000 Cus tom ers Orders Line Item s Global Cus tom er CAA E m ails ,efax ,EOC M ailbox 100,000 pro du c ts 200+ fac to rie s 160 + c oun tri es

Process – Success Glide Path

M ANAGED OPTIM ISED ADHOC

Customer Account Analysts

M FG CAA enters the

  • rd

er the m s el v e s CAA Pre off-s hori ng – 9 5% , 2 4 h

  • u

rs Pre

  • ff

s ho ri ng

POST OFF SHORIN G

2008 – II Ha lf 2009 full y e ar 2008 – I Hal f 2007

Basics

Customer’s problem with our Quality

M FG SO Sales Cus tom er PO PO TO SO 2500 12,000 50,000 Cus tom ers Orders Line Item s Global Cus tom er CAA E m ails ,efax ,EOC M ailbox 100,000 pro du c ts 200+ fac to rie s 160 + c oun tri es

Process – Success Glide Path

M FG Quality Chec k Order Entry CAA Bas ic proc es s - 92 %, 9 h

  • u

rs M ANAGED OPTIM ISED ADHOC

Customer Account Analysts

M FG CAA enters the

  • rd

er the m s el v e s CAA Pre off-s hori ng – 9 5% , 2 4 h

  • u

rs Pre

  • ff

s ho ri ng

POST OFF SHORIN G Challenges Legacy system No GUI

2008 – II Ha lf 2009 full y e ar 2008 – I Hal f 2007

Quality – measured as defectiv e orders ev ery week

5 10 15 20 25 30 Wk 1 Wk 4 Wk 7 Wk 10 Wk 13 Wk 16 Wk 19 Wk 22 Wk 25 Wk 28 Wk 31 Wk 34 Wk 37 Wk 40 Wk 43 Wk 46 Wk 49 Wk 52 Wk 3 Wk 6 Wk 9 Wk 12 Wk 15 Wk 18 Wk 21 Wk 24 Wk 27 Wk 30 Wk 33 Wk 36 Wk 39 Wk 42 Wk 45 Wk 48 Wk 51

Internal External

93%

Microsoft Office 97-2003 Worksheet

Customer Satisfaction Survey – Feb 2008 – NEUTRAL

NEUTRAL

2008 2009

slide-3
SLIDE 3

3

Quality – measured as defectiv e orders ev ery week

92%

Microsoft Office 97-2003 Worksheet

CSAT and QBR remarks Quality c ontin ues to b e a c hallenge on Order E n try Too m uc h v ari ab i lity fro m agent to agen t on

  • rde

r ac c urac y Need to balanc e th e le v e l

  • f quality to

m ak e educ ated dec is ion s Im prov em ents in QA proc es s at HCL to det ec t errors M os t of the qu ali ty is s ue s s eem to be ba s i c e rrors

Customer Satisfaction Survey – June 2008 – DISSATISFIED

DISSATISFIED NEUTRAL

2008 2009

Basics

Phase I “Managed” Solution with “Best Practices”

Diagnostic approach

Problems (Standard ones) Incomplete Orders Legacy system – Typo errors Knowledge Transfer is missing No individual performance measure

Process People Attitude

Solutions (Best Practices) Validation Peer review Training Executive Score Card Peer Check Continuous Updating Visibility to Quality Quality as a matter of pride

Valid Peer Quality M ailbox Entry Quality M ailbox

? 4

defe c ts till now Entry Entry Entry Entry Entry Entry Entry Valid Peer Valid Peer Valid Peer

Oversight errors No discipline in “updating databases” Focus on task completion Quality as a mere metric

M FG SO Sales Cus tom er PO PO TO SO 2500 12,000 50,000 Cus tom ers Orders Line Item s Global Cus tom er CAA E m ails ,efax ,EOC M ailbox 100,000 pro du c ts 200+ fac to rie s 160 + c oun tri es

Process – Success Glide Path

M FG Quality Chec k Order Entry CAA Bas ic proc es s - 92 %, 9 h

  • u

rs M ANAGED OPTIM ISED ADHOC

Customer Account Analysts

M FG CAA enters the

  • rd

er the m s el v e s CAA Pre off-s hori ng – 9 5% , 2 4 h

  • u

rs Pre

  • ff

s ho ri ng

POST OFF SHORIN G Challenges Legacy system No GUI

2008 – II Ha lf 2009 full y e ar 2008 – I Hal f 2007 Peer Chec k Quality Chec k Order Entry Validation Bes t Prac tic es in to the p roc es s –97 %

  • 99

%, 15 h

  • u

rs M FG CAA

Quality – measured as defectiv e orders ev ery week

92%

Microsoft Office 97-2003 Worksheet

CSAT and QBR remarks Quality c ontin ues to b e a c hallenge on Order E n try Too m uc h v ari ab i lity fro m agent to agen t on

  • rde

r ac c urac y Need to balanc e th e le v e l

  • f quality to

m ak e educ ated dec is ion s Im prov em ents in QA proc es s at HCL to det ec t errors M os t of the qu ali ty is s ue s s eem to be ba s i c e rrors

Customer Satisfaction Survey – June 2008 – DISSATISFIED

Operational Ex c e lle nc e Quality Driv e Order Validation Peer Chec k Ex ec utiv e Error His tory CN updation

T e a m E x c e l l e n c e T e a m E x c e l l e n c e

M PDB im plem enta tion upled Peer Rev iew - SPOC & Coupled Training & onli ne t es t Ex ec utiv e s c

  • re

c ard Vis ibility to Quali ty

DISSATISFIED NEUTRAL

2008 2009 Phased implementation

  • f 10 initiatives

Quality – measured as defectiv e orders ev ery week

“The specific improvements to OE Quality are very much appreciated 25-Oct-08”– Oct 2008 CSAT

Microsoft Office 97-2003 Worksheet

Operational Ex c e lle nc e Quality Driv e Order Validation Peer Chec k Ex ec utiv e Error His tory CN updation

T e a m E x c e l l e n c e T e a m E x c e l l e n c e

M PDB im plem enta tion upled Peer Rev iew - SPOC & Coupled Training & onli ne t es t Ex ec utiv e s c

  • re

c ard Vis ibility to Quali ty

DISSATISFIED NEUTRAL

2008 2009 Phased implementation

  • f 10 initiatives
slide-4
SLIDE 4

4

Quality – measured as defectiv e orders ev ery week

“The specific improvements to OE Quality are very much appreciated 25-Oct-08”– Oct 2008 CSAT

Microsoft Office 97-2003 Worksheet

Operational Ex c e lle nc e Quality Driv e Order Validation Peer Chec k Ex ec utiv e Error His tory CN updation

T e a m E x c e l l e n c e T e a m E x c e l l e n c e

M PDB im plem enta tion upled Peer Rev iew - SPOC & Coupled Training & onli ne t es t Ex ec utiv e s c

  • re

c ard Vis ibility to Quali ty

SATISFIED

Client on Quality The s pec ific im prov em ents to OE Quality are v ery m uc h ap prec iat ed 25-Oc t-08

DISSATISFIED NEUTRAL

2008 2009 Phased implementation

  • f 10 initiatives

Basics

However the process timing worsens

Turn Around Time starting increasing substantially … 2008 2009

15 hr

Turn Around Time starting increasing substantially …

Viswanathan SVB on TAT You are s itting

  • n

a v olc ano Cy c le Tim e ne ed to be foc us ed as p er th e agreed SLA Vis wanathan, OEG

T

Day to day VOC – Tim e Delay in proc e s s ing Delay in refer fi x in g Urgenc y ignored

T

2008 2009

Basics

Soon the defects also increased..

Quality – measured as defectiv e orders ev ery week

“The specific improvements to OE Quality are very much appreciated 25-Oct-08”– Oct 2008 CSAT

Microsoft Office 97-2003 Worksheet

Operational Ex c e lle nc e Quality Driv e Order Validation Peer Chec k Ex ec utiv e Error His tory CN updation

T e a m E x c e l l e n c e T e a m E x c e l l e n c e

M PDB im plem enta tion upled Peer Rev iew - SPOC & Coupled Training & onli ne t es t Ex ec utiv e s c

  • re

c ard Vis ibility to Quali ty

SATISFIED

Client on Quality The s pec ific im prov em ents to OE Quality are v ery m uc h ap prec iat ed 25-Oc t-08

DISSATISFIED NEUTRAL

2008 2009

slide-5
SLIDE 5

5

Quality also started worsening again …

97%

Microsoft Office 97-2003 Worksheet

SATISFIED DISSATISFIED NEUTRAL ? Predicting the VOC Simultaneous worsening of both TAT and Quality

Day to day VOC - OE Repeat of is s u es Wrong judgem e nt Careles s nes s Unnec es s ary e s c ala tion Wrong ac k nowle dge m e n t Spec ial ins tru c ti

  • ns

ignored Repeated es c a lati

  • ns

Poor v alidatio n

Q Q T

2008 2009

Basics

We realised our solutions were not sustainable

Basics

We tried to understand this reversal of performance

Theory 1 - Hawthorne Effect

Attention improves performance (and not the lighting!) In our case When there was attention, all best practices were followed to improve performance Once attention is withdrawn, performance reverts back to previous levels Once declared a success and attention was removed, all best practices were given up, and performance reverted to

  • riginal levels

18th Century shop floor experiment on social behaviour of teams

Goal - Optimal lighting for maximising productivity Result – Productivity improved with both increase and decrease in lighting!

Basics Why? Because Good people did not follow the Best practices

Validate Peer Check Training Monitoring “We do not like them”

Operational Excellence without a human face

.

2008 initiatives

Te a m Ex c e l l e n c e Te a m Ex c e l l e n c e

Innovation Applying “TPS”+”Cognitive Dissonance” Employee reaction to the initiative “Not with a Human Face”

Validate Peer Check Peer Couple Training and Online Test Executive Score Card Executive Error History Quality Error Drive Team Building CN Update M BDB Update “ Questions my Optimism and Confi dence ” “ Hurts my Ego” “ Too much Policing” “ Why learn what I alrea dy kn

  • w?”

“ I am measured” Low Impact knowledge Good, but not great Not all are working Practical, but partial CELL Best Practices into Roles Roles linked to Cells Single Piece Flow through the Cell PULL (Inbuilt Check) Auto QC at every stage Auto TAT check at every stage PERPETUAL VISIBILITY Non-Value Added Time Quality M onitoring PERPETUAL TRAINING Stop, Correct, Proceed

Voice of employees 2 0 0 8 Voice of employees 2 0 0 8 Voice of employees 2 0 0 8 – – “ Why performance not sustained ?” “ Why performance not sustained ?” “ Why performance not sustained ?”

Thus, Best Practices actually reduced Job Satisfaction

slide-6
SLIDE 6

6

Basics

Phase II Optimized Solution Operational Excellence with a Human Face

Theory 2 – Cognitive Dissonance Theory

Attitude changes behaviour (normally) In our case The attitude of dislike towards best practices, changed behaviour away from best practices Behaviour changes attitudes (if there is a cognitive dissonance) If “best practices” behaviour is tactfully ensured will it change the attitude in favour? 20th Century college experiment on social behaviour of teams

Rare incident - Yale Univ. students manhandled by police An experiment on changing this attitude by changing behaviour

Valid Entry Peer Quality High NVT Entry M onitor M ailbox Entry Valid Peer Quality Entry Cell System M ailbox

One person – all roles One person - one order end-to-end He skips processes Cell system Cell System and Pull System Validation, order entry and Peer Check are not processes but Roles One person one role Role linked into a cell One order – not with one person but with one full cell Single piece flow . No role skipped Pull system QC by the next role TAT check by the next role

Theory 3 – Toyota Production System - Roles - Cell – Pull as the strategy

Before After Cell is a mistake-proofing me chanis m to ensure that processe s are not sk ipped From Processes to Roles

Best practices become a behaviour

Valid Entry Peer Valid Entry Peer Valid Entry Peer Entry M onitor Stop, Correc t & Proc ee d M ailbox Entry Valid Peer Quality Entry Defec t Cell System

Quality - 99%

Theory 3 – Toyota P roduction System - “ Stop- Correct-P roceed” as a micro training strategy

Feedback to the executive is sporadic Feedback only for poor performers Feedback

  • immediately after identifying the error
  • generally minutes after making the error
  • To the entire team in a huddle
  • Complete analysis and root causing
  • A focused micro training
  • Work stops, learning happens

and then work starts Monitor provides perpetual visibility TAT Before After

Harnesses the ‘rec ency ’ benefit to impr

  • ve learning

Micro training as a strategy to avoid boredom

More best practices become a behaviour

Theory 3 – Toyota P roduction System - P erpetual and detailed visibility for TAT – 24 X 7 REPORT

Supply Chain Velocity

Global Cus tom er M ailbox Validation Peer Chec k Quality Chec k Order Entry Final Ack E m ails Wait Wait Wait Wait Wait Refer Fix ing Wait Value Added Tim e Non Value Added T im e + Es c alation Res pons e

Available every second. Shared hourly with the entire team. “24 x 7” report

Earlier 15 hours. Now just 4 hours

Further more best practices into behaviours

Do not try t

  • work f

aster Just schedule bet ter Wait > V A T

More visibility from the 24/7 Report

SLA - TAT perf

  • rm

anc e rep

  • rt

Utility Flow of orders a nd ba la nc e s he et

slide-7
SLIDE 7

7

Perpetual v isibility on Non Value Added T ime

Week 47 , 2008 Week 39 , 2009 > 12 hours < 4 hours

Best Practices became behaviours

.

2008 initiatives

Te a m Ex c e l l e n c e Te a m Ex c e l l e n c e

Innovation Applying “TPS”+”Cognitive Dissonance” Employee reaction to the initiative “Not with a Human Face”

Validate Peer Check Peer Couple Training and Online Test Executive Score Card Executive Error History Quality Error Drive Team Building CN Update M BDB Update “ Questions my Optimism and Confi dence ” “ Hurts my Ego” “ Too much Policing” “ Why learn what I alrea dy kn

  • w?”

“ I am measured” Low Impact knowledge Good, but not great Not all are working Practical, but partial CELL Best Practices into Roles Roles linked to Cells Single Piece Flow through the Cell PULL (Inbuilt Check) Downstream : Auto QC at every stage Upstream: Auto TAT check at eve ry stag e PERPETUAL VISIBILITY Non-Value Added Time Quality M onitoring PERPETUAL TRAINING Stop, Correct, Proceed

Synopsis on Diagnostic approach and Methodology of implementation Synopsis on Diagnostic approach and Methodology of implementation Synopsis on Diagnostic approach and Methodology of implementation

Basics When best practices become behaviours, what happens to the attitude

Voice of employees 2009 Voice of employees 2009 Voice of employees 2009 -

“Behaviour Behaviour Behaviour changes attitudes” changes attitudes” changes attitudes”

  • “Wonderful concept to make things happen”
  • “Ownership of role “
  • “Roles are defined very clearly and make us work at ease

  • “Team members develop expertise to their role “
  • “People have become more responsible in the role they play as it becomes their duty

to make it error free”

  • “New agents can enter the
  • rder at real quick time with less error because
  • f the

validation process”

  • “Increase the confidence level of new joiners for processing orders without defects“
  • “Because of the peer chec

k, there is always a cushion for the validator and OE agents as they can feel much comfortable while entering orders”

  • “Employee Involvement – It emphasize the team to integrate with work cells for

motivation”

Secret ballot Secret ballot Secret ballot – – “ Type and Drop” “ Type and Drop” “ Type and Drop” -

  • Survey dated 2

Survey dated 2 Survey dated 2nd

nd nd Nov 2009

Nov 2009 Nov 2009 Emotive comments

M FG SO Sales Cus tom er PO PO TO SO 2500 12,000 50,000 Cus tom ers Orders Line Item s Global Cus tom er CAA E m ails ,efax ,EOC M ailbox 100,000 pro du c ts 200+ fac to rie s 160 + c oun tri es

Process – Success Glide Path

M FG Quality Chec k Order Entry CAA Bas ic proc es s - 92 %, 9 h

  • u

rs M ANAGED OPTIM ISED ADHOC

Customer Account Analysts

M FG CAA enters the

  • rd

er the m s el v e s CAA Pre off-s hori ng – 9 5% , 2 4 h

  • u

rs Pre

  • ff

s ho ri ng

POST OFF SHORIN G Challenges Legacy system No GUI

2008 – II Ha lf 2009 full y e ar 2008 – I Hal f 2007 Peer Chec k Quality Chec k Order Entry Validation Bes t Prac tic es in to the p roc es s –97 %

  • 99

%, 15 h

  • u

rs M FG CAA Toy ota Produ c t io n Sy s t em , an d Cogn iti v e Dis s o na nc e Th eo ry Peer Chec k Quality Chec k Order Entry Order Entry Order Entry M onitor CAA Validation Cell Sy s tem –99% , 4 h

  • u

rs 10 m ins 10 m ins 10 m ins 30 m ins M FG

Basics

Sustainable results

slide-8
SLIDE 8

8

Quality – measured as defectiv e orders ev ery week

5 10 15 20 25 30 Wk 1 Wk 4 Wk 7 Wk 10 Wk 13 Wk 16 Wk 19 Wk 22 Wk 25 Wk 28 Wk 31 Wk 34 Wk 37 Wk 40 Wk 43 Wk 46 Wk 49 Wk 52 Wk 3 Wk 6 Wk 9 Wk 12 Wk 15 Wk 18 Wk 21 Wk 24 Wk 27 Wk 30 Wk 33 Wk 36 Wk 39 Wk 42 Wk 45 Wk 48 Wk 51

Internal External

99.5% Toyota Production System Cognitive Dissonance Theory

Microsoft Office 97-2003 Worksheet

2008 2009

SUBSTANTIALLY IMP ROV EME NT IN TA T – NOW A T LES S THA N 4 H OURS 3:40 hr

“Very satisfied” rating on two consecutive CSAT’s – May and August CSAT

Client Satisfaction - TAT

15 hr

2008 2009

45

Voice of the Customer / CTQs

D E FI N E 14 D ec t o 21 D ec 2008

Client on Quality The s pec ific im prov em ents to OE Quality are v ery m uc h ap prec iat ed 25-Oc t-08 Quality SPOC We hav e gotten better c ontrol o v e r errors , and foc u s o n

  • ther area

s in O M – Client Quality SPO C , 07-M ay -09 CSAT and QBR remarks Quality c ontin ues to b e a c hallenge on Order E n try Too m uc h v ari ab i lity fro m agent to agen t on

  • rde

r ac c urac y Need to balanc e th e le v e l

  • f quality to

m ak e educ ated dec is ion s Im prov em ents in QA proc es s at HCL to det ec t errors M os t of the qu ali ty is s ue s s eem to be ba s i c e rrors Client Tim BPO M anager Client Angela Quality SPOC OEG Viswaanthan SVB Viswanathan SVB on TAT You are s itting

  • n

a v olc ane Cy c le Tim e ne ed to be foc us ed as p er th e agreed SLA Vis wanathan, OEG Customer Delight in CSAT – Client Res pons iv ene s s to las t CSAT Surv e y to driv e im prov e m e n ts in Order Entry TAT and Quality

Predicting the VOC Simultaneous worsening of both TAT and Quality resulting in this Black Belt Project

Day to day VOC - OE Repeat of is s u es Wrong judgem e nt Careles s nes s Unnec es s ary e s c ala tion Wrong ac k nowle dge m e n t Spec ial ins tru c ti

  • ns

ignored Repeated es c a lati

  • ns

Poor v alidatio n Day to day VOC – Tim e Delay in proc e s s ing Delay in refer fi x in g Urgenc y ignored QBR concluding remark - Client With the bus in es s m aturing and wi th quality and T AT c om ing unde r c ontrol, HCL need s to graduate to a higher platform w ith a foc us on Val ue Added Serv ic es . Red – Negative VOC on Quality and T AT Green – Positive VOC on both

Q T Q Q T T T Q Q Q 10% or 250 additional customers confirm “timely response” in 2009 10% or 250 additional customers have Moved from being indifferent to being appreciative in 2009

End Customer Satisfaction – measured as perceiving timely response Conceptual Model of “Economics of Quality”

  • 7. Business Lost

$500

  • 1. Inventory Cost

$4

  • 2. 1 day extra bus

iness

$200

  • 3. Reduced Cancellati
  • n
  • f Orders

$1,000

  • 4. Better Servicing

$2,000

Derived paramete rs USD $ Value per c us t

  • m e

r 120,000

  • No. of Orders

6

  • No. of Line Item

s 24 Value per order 20,000 Value per line item 5,000 Value per day 1,200,000

Total

$3,204

Total savings $4,200

Basic parameters USD $m Bus ines s turn

  • v

er 300 Num ber of c us to m ers 2,500 Num ber of orders ann ual ly 15,000 Line item s p er ord er 4 Num ber of bus in es s da y s 250

  • 1. Internal Defect

$21

  • 3. Customer Identified Error

$169

  • 5. Return of Stock

$700

  • 6. Damages in Return

$500

  • 4. This order goes to c
  • mpeti

tion

$2500

  • 2. External De

fec t

$84

Annualised benefits from the project

By avoiding costs USD $ Cost of rework 55,562 Business lost through wrong dispatches 400,000 Return cost of wrong dispatches 192,000 Customer loyalty and business erosion through wrong dispatches 1,920,000 Interest cost saved through faster cash cycle 98,630 Total savings 2,666,192 By increasing revenue Growth from quicker TA T - with one additional day of business 480,000 Growth in business from reduced cancellation of orders 2,400,000 Growth in business from better servicing 4,800,000 Total earnings 8,880,000 Total savings plus earnings 10,346,192 Savings and earnings from the project - USD 10.3 million At Rs 46.53 to a dollar the Economic value of the Quality initiatives Rs 48 crores

slide-9
SLIDE 9

9

49

COPQ – before and after

Teal Lead C A A T L C l i ent Q ual i t y S P O C Ti m Q ual i t y P M

Internal Quality External Quality Customer Compliant Not involved

Chec k : Fix : Com 2

Business $ 300 m/yr Internal Quality $ 20 per error 200 errors per year

$ 4,050 per year

Learn:Com :Clarif y 2

5

Per order-line $5,000

Lea rn 5

Per customer $0.3 m

Learn 5

Tran s/ line :7% $350

Lis ten: Cas c ade : 25

Return cost -$700

Huddle : 5*5 = 25

Damag 10% $500

Learn 5

Loyal loss 1%

$3,000

Learn

5

Cost -$ 4,200

$ 105,850

Team Team Team

Week ly c a ll Chec k :Fix :Com 25 Huddle : 5*5 = 25 Learn 5

minutes

5 5

Week ly c a ll

5 5

HCL - $14 per hour Client - $75 per h

  • u

r

External Quality $ 89 per error 200 errors per year

$ 17,800 per year

Customer Compliant 10% of External Errors $ 4,200 per error 20 errors per year

$ 84,000 per year

Achieved Internal Quality 120 External Quality 30 External Errors 3

$ 17,700 per year BB SAVING $ 88,150 (actual) $ 66,156 (target)

ak-COPQ-Before and After

Problem

Bes t Prac tic es Im plem en te d Initial Suc c es s

The “Employee First” works!!!

Employee Attitudes about Best Practices not always positive

Aided by Hawthorne Effec t Hawthorne Effec t Wanes Suc c es s n

  • t

Sus tained Small Innovative Solution “ OE 2009” Inspired by Cognitive Dissonance Inspired by TPS

V al i dat i on P eer C heck M oni t ori ng Trai ni ng V i rt uous C ycl e

The project in brief

S i x “S i x S i gma” P roj ect B asket M S C R M Tool S C O R P

High Em ploy ee Satis fac tion Sus tainab le Perform anc e Client Satis fied End – Us er Satis fied

K ai zen

From Cognitive Dissonance

Best practices not as tasks but as ROLES Change behaviour to change attitude

C

  • nf i dence

E go N

  • use

I know

From Toyota Production System

Roles linked into a Cell Continuous monitoring - Visibility – NVAT Stop – Correct - Proceed

1. Base your management decisions on a long-term philosophy, even at the expense of short- term financial goals 2. Create a continuous process flow to bring problems to the surface 3. Use "pull" systems to avoid overproduction 4. Level out the workload 5. Build a culture of stopping to fix problems, to get quality right the first time 6. Standardized tasks and processes are the foundation for continuous improvement and employee empowerment 7. Use visual control so no problems are hidden 8. Use only reliable, thoroughly tested technology that serves your people and processes 9. Grow leaders who thoroughly understand the work, live the philosophy, and teach it to others

  • 10. Develop exceptional people and teams who follow your company's philosophy
  • 11. Respect your extended network of partners and suppliers by challenging them and helping

them improve

  • 12. Go and see for yourself to thoroughly

understand the situation

  • 13. Make decisions slowly by consensus, thoroughly considering all options; implement

decisions rapidly

  • 14. Become a learning organization

through relentless reflection (hansei) and continuous improvement (kaizen) 2Toyota Production System – our inspiration 2008

  • Our sincere thanks to
  • Our jury:
  • Mr. A.K. Jain, Executive Director BHEL
  • Mr. S Chandrasekhara Borate, Head STQC, Dept of IT and Electronics
  • Dr. S N Nandi, DDN, NPC

Dr . Anil K Srivatsava, Director, Institute of Applied Statistics and Quality

  • Mr. A K Sharma, RITES

Our organisers:

  • Dr. Girdhar J. Gyani
  • Mr. Avik Mitra, Advisor
  • Mr. A K Raju, Executive Officer
  • M FG

SO Sales Cus tom er PO PO TO SO 2500 12,000 50,000 Cus tom ers Orders Line Item s Toy ota Produ c t io n Sy s t em , an d Cogn iti v e Dis s o na nc e Th eo ry Global Cus tom er CAA E m ails ,efax ,EOC M ailbox Peer Chec k Quality Chec k Order Entry Order Entry Order Entry M onitor CAA Validation Cell Sy s tem –99% , 4 h

  • u

rs 10 m ins 10 m ins 10 m ins 30 m ins 100,000 pro du c ts 200+ fac to rie s 160 + c oun tri es

Process – Success Glide Path

Peer Chec k Quality Chec k Order Entry Validation Bes t Prac tic es in to the p roc es s –97 %

  • 99

%, 15 h

  • u

rs M FG Quality Chec k Order Entry CAA Bas ic proc es s - 92 %, 9 h

  • u

rs M ANAGED OPTIM ISED ADHOC

Customer Account Analysts

M FG CAA enters the

  • rd

er the m s el v e s CAA Pre off-s hori ng – 9 5% , 2 4 h

  • u

rs Pre

  • ff

s ho ri ng M FG CAA M FG

POST OFF SHORIN G Challenges Legacy system No GUI

2008 – II Ha lf 2009 full y e ar 2008 – I Hal f 2007

slide-10
SLIDE 10

10

Valid Entry Peer Quality M ailbox Valid Entry Peer Valid Entry Peer Valid Entry Peer Entry M onit M ailbox Entry Valid Peer Quality Entry Cell System

From Processes to Roles Before After

56

2

Exceeding client expectations on key SLA metrics - Quality and TAT A Lean Six Sigma Black Belt presentation

Revision No: Working Version Rev: Dat e :November 2 , 2 0 0 9

BB/ QA / N0 / 0001 Project leader : B Viswanathan (Visu) Guide : R Gajendran (Gajen)

Project Team : Anand, John, Purush, Williams, Delli, George, Arun

57

Education – 18 years 1979 NCERT - NTSU National Talent Search Examination Scholarship holder 1983 B.Sc.(Agriculture Sciences) Tamil Nadu Agricultural University, Coimbatore Topper OGPA :4/4 1986 PGDM – SPA (IIM – A) I Schol 12t h rank 1997 Certificate Course on Excise, Customs , Imports, Exports, Foreign Exchange Indian School of Materials Management Stood 2nd with Distinction 2009 Six Sigma – Black Belt, from HCL-B P O Employment experience – 23 years 1986 Godrej and Enfield Management Trainee 1 year 1987 Syngenta Area Sales Manager 5 years 1993 Sales Manager - 2 years 1995 Product Manager - 1 year 1996 Supply Chain Manager 4 years 1999 Business Development Manager 1 year 2000 Marketing Manager 5 years 2005 Mahindra & Mahindra Senior General Manager 1 year 2006 Reliance Retail Associate Vice President; 2 yea rs Head of Operations; Head of Strategy and Planning 2008 HCL - BPO General Manager Supply Chain Practice 1 year

Profile : Balasubramanian Viswanathan