
SLIDE 1
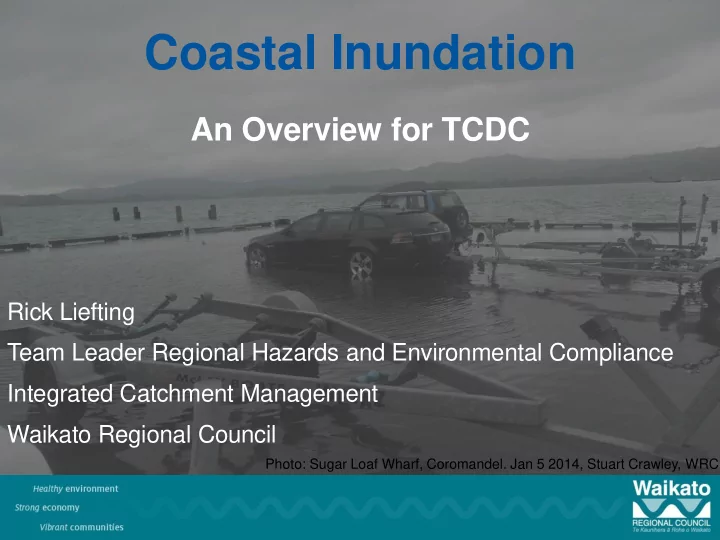
Photo: Sugar Loaf Wharf, Coromandel. Jan 5 2014, Stuart Crawley, WRC
Coastal Inundation
An Overview for TCDC
Rick Liefting Team Leader Regional Hazards and Environmental Compliance Integrated Catchment Management Waikato Regional Council