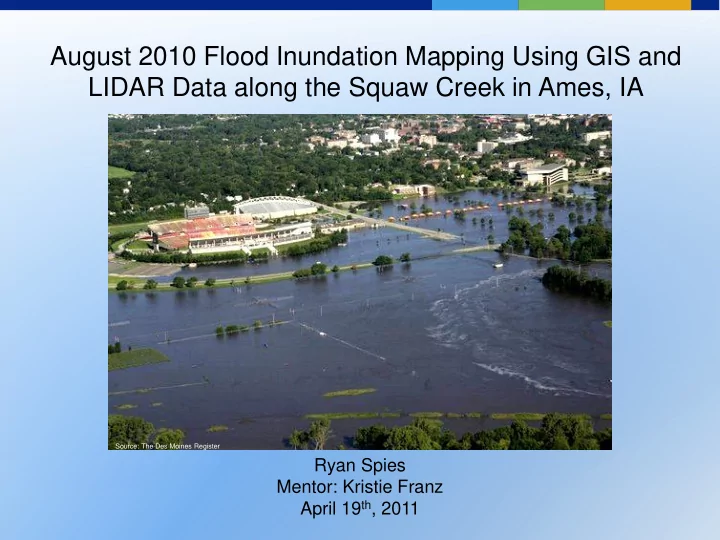
August 2010 Flood Inundation Mapping Using GIS and LIDAR Data along the Squaw Creek in Ames, IA Source: The Des Moines Register Ryan Spies Mentor: Kristie Franz April 19 th , 2011
Outline • Motivation & Background • Goals • Hypothesis • Data & Methodology • Results • Conclusions
Motivation & Background • Historical crests for Squaw Creek include: • 1993: 18.54 ft • 2010: 18.13 ft • 1990: 15.97 ft • 2008: 15.85 ft *flood stage is 9 ft and major flood stage is 15 ft • August 8 th , 2010 to August 11 th , 2010 the Squaw Creek watershed received widespread 8 to 10+ inches of rainfall • Damage expected to cost Iowa State University about $30 million
Goals • Attempt to recreate the flooding that occurred along the Squaw Creek in Ames using a River Model • Develop a flood inundation map- show the extent of flooding that should be expected spatially over a given area • Examine the impact of University Blvd on the flood extent along Squaw Creek by generating several model scenarios with different street elevations (including possible mitigation strategies)
Hypothesis • By examining the topography of the stream and floodplain along this reach of Squaw Creek, I hypothesized that raising the elevation of University Blvd would further protect property on the west side of the creek to some extent.
Ames Des Moines
Data & Methodology • ArcGIS (geographic information systems) and ArcMap to generate stream channel profiles for the Squaw Creek from 6 th Street to S 16 th Street • LIDAR (light detection and ranging) for topographic data • Enter data into HEC-RAS (Hydrologic Engineering Centers River Analysis System) to create flood model results • Compare results to actual flood images taken during the flood
Study Area ~2.92 sq km (1.13 sq mi)
Data Extrapolated Using ArcMap • Stream Center Line: river profile (line feature) • River reach starting and ending locations (point feature) • Stream Banks: left and right river bank (line feature) • Cross Sections: 2 dimensional elevation data for model flow calculations (line feature) • Levee Feature: symbolized University Blvd as a flood containment land feature (line feature) •Ground Cover: Manning’s surface roughness coefficients (polygon feature)
Ames, IA LIDAR Data (1meter resolution)
Cross Section Stream Gauge generated by Location HEC-RAS from LIDAR digital elevation model
HEC-RAS • Input stream rating curve and August 2010 flood crest values from USGS river monitoring station near Lincoln Way • Ran model under steady state conditions ( unchanging flow through time) and subcritical flow
HEC-RAS cont. •Model Uses Manning’s Equation for flow calculations Discharge (Q) Velocity (V) Flow Area (A) Hydraulic Radius (R) Channel Slope (S) Manning’s surface roughness coefficients (n) • Model results were then exported into ArcMap for Inundation Mapping
Assumptions • Bridges and culverts were ignored for simplicity • Only one stream gauge in study area • Rating curve and river stage values assumed to be constant throughout study area (minimal inputs from other sources) • HEC-RAS limitation only allowed one levee on each side of stream (ignored the effects of South 4 th St)
Methods • Examined 4 cases involving University Blvd 1) University Blvd at current elevation (control) 2) University Blvd removed (lowered) 3) University Blvd raised 1.22 meters (~4 feet) 4) University Blvd raised 1.67 meters (~5.5 feet) • Created an observed flood extent layer in ArcMap using aerial images taken during flood crest • Compared model flood extent to observed flood extent
Photos from The Des Moines Register
Observed Flood Extent
Model Flood Extent Current topographic conditions
Model Flood vs. Observed Flood Extent Current topographic conditions • Model flood produced a slightly lower stage than observed possibly due to assumptions made
Model Flood Extent Removed University Blvd (lowered)
Model Flood vs. Observed Flood Extent Removed University Blvd (lowered) • Model flood produced a slightly lower stage similar to that of original topography
Model Flood Extent Raised University Blvd 1.22 meters (~4 Inundated feet) • Overtopping University Blvd north of Lincoln Way • Cross section cutoffs due to steady state limitations in model • Limited increase in flooding to the east
Model Flood Extent University Blvd raised 1.67 meters (~5.5 feet)
Model Flood vs. Observed Flood Extent University Blvd raised 1.67 meters (~5.5 feet) • Flood contained east of University Blvd • Important to remember HEC-RAS one dimensional model is being ran using the current rating curve • Important changes upstream and downstream to consider
Model cross section near ISU Soccer Complex with 2010 flood values and University Blvd raised 4 feet (flood crest overtopping University Blvd. Model cross section near ISU Soccer Complex with 2010 flood values and University Blvd raised 5.5 feet (flood crest contained by University Blvd).
Conclusions • Current University Blvd has little effect on limiting major flood events • A substantial increase in the elevation of University Blvd is needed to effectively mitigate major floods • May be more reasonable and economical solutions upstream or within the Squaw Creek watershed • ArcGIS and HEC-RAS software are useful tools that can be used to better understand and prepare for flood events
Conclusions cont. • More stream gauge data needed for model to run in unsteady conditions which may provide more accurate results • Further study might examine how ground cover changes could mitigate flood • May be newer and better river modeling software that could be used - Need a model to allow for more levees to understand the effects Lincoln Way and South 4 th St have on flooding in this area
Acknowledgements • Mentor: Kristie Franz • Grad Students: Chris Karstens, Joo-Yup Han, Logan Karsten
Recommend
More recommend