
SLIDE 1
Photo: Will Brown
Mapping Chronic Inundation 1. Tide gauge records Photo: NOAA 2. - - PowerPoint PPT Presentation
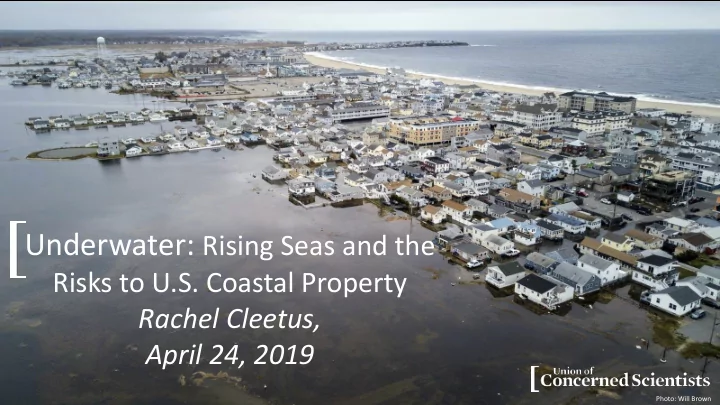
Underwater: Rising Seas and the Risks to U.S. Coastal Property Rachel Cleetus, April 24, 2019 Photo: Will Brown Mapping Chronic Inundation 1. Tide gauge records Photo: NOAA 2. Digital Elevation Models 3. Sea level rise projections [ Homes
Photo: Will Brown
Photo: NOAA
Data provided by third parties through the Zillow Transaction and Assessment Dataset (ZTRAX). More information on accessing the data can be found at https://www.zillow.com/ztrax.
Data provided by third parties through the Zillow Transaction and Assessment Dataset (ZTRAX). More information on accessing the data can be found at https://www.zillow.com/ztrax.
Data provided by third parties through the Zillow Transaction and Assessment Dataset (ZTRAX). More information on accessing the data can be found at https://www.zillow.com/ztrax.
Data provided by third parties through the Zillow Transaction and Assessment Dataset (ZTRAX). More information on accessing the data can be found at https://www.zillow.com/ztrax.
Data provided by third parties through the Zillow Transaction and Assessment Dataset (ZTRAX). More information on accessing the data can be found at https://www.zillow.com/ztrax.
http://ucsusa.org/underwater
Data provided by third parties through the Zillow Transaction and Assessment Dataset (ZTRAX). More information on accessing the data can be found at https://www.zillow.com/ztrax.
Data provided by third parties through the Zillow Transaction and Assessment Dataset (ZTRAX). More information on accessing the data can be found at https://www.zillow.com/ztrax.
Data provided by third parties through the Zillow Transaction and Assessment Dataset (ZTRAX). More information on accessing the data can be found at https://www.zillow.com/ztrax.