SLIDE 1
Chapter 5: Remote Sensing
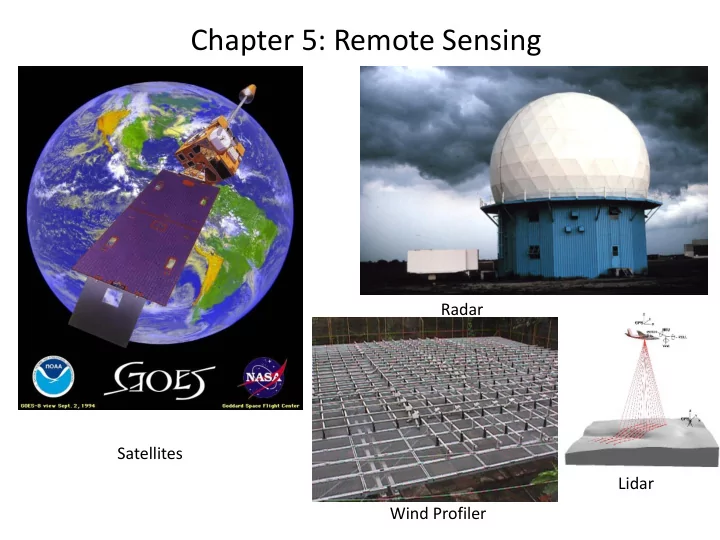
Satellites Wind Profiler Radar Lidar
SLIDE 2 Satellites: Geostationary vs. Polar Orbiting
- What does geostationary mean?
- Resolution determined by distance and wavelength
SLIDE 3 Satellites: Visible, Infrared, and Water Vapor
- Sensing devices are called radiometers
- Sensitive at different wavelengths
- Difference wavelengths reveal different information about weather
- It take practice to use satellites to infer information about clouds and weather
http://cimss.ssec.wisc.edu/satmet/modules/index.html
SLIDE 4 Satellites: Visible
ADVANTAGES
- High resolution (1 km and less)
- Intuitive interpretation (like a photo)
- Can see more than clouds when clear
- Easy to distinguish different cloud types
DISADVANTAGES
- Blind at night
- No information about temperature
SLIDE 5
Visible Satellites: what is this?
SLIDE 6
Visible Satellites: Why are the lakes clear?
SLIDE 7
Visible satellites: More than clouds
SLIDE 8
http://modis.gsfc.nasa.gov/gallery/
SLIDE 9 Satellites: Infrared
ADVANTAGES
- Direct information about temperature
- Can provide vertical profile of Temp. when clear
- Equally effective at night
DISADVANTAGES
- Lower resolution (4+ km)
- Interpretations non-intuitive
SLIDE 10
Infrared Satellites: Sensitive to temperature
SLIDE 11
Infrared Satellites: “False Color” and cloud top temp
Bright= cold=high=strong storms (maybe)
SLIDE 12 Doppler Radar
ADVANTAGES
- Direct Measurement of falling precipitation
- Strong indication of precipitation intensity
- Can detect hail and indicate likely tornados
- Doppler Effect can help determine wind patterns
- Can “see” birds, insects, dust
DISADVANTAGES
- Hard to distinguish between rain and snow
- Useless when clear (no wind info)
- Range and resolution are limited
http://www.srh.noaa.gov/srh/jetstream/doppler/doppler_intro.htm
SLIDE 13
NEXRAD 88-D radar locations
http://water.weather.gov/
SLIDE 14
NEXRAD 88-D radar locations
Beams cover about 250 mile diamter
SLIDE 15 NEXRAD 88-D radar beams:
- Radar beam covers about 1 degree angle
- The further away from the radar you are, the wider the beam spreads
- This causes decreased resolution at long distance
SLIDE 16 Radar Beam Geometry
- These are the direction that the radar beam is sent out and received
- These 16 angles are rotated through a full 360 degrees
- The entire sky volume is scanned in 5 minutes
- This output can give a 3-D dimensional view of a storm, though usually we
- nly look at the “base” reflectivity.
- The base reflectivity represents a higher height further from the radar
SLIDE 17
Doppler Radar: Thunderstorm closeup
SLIDE 18 Doppler wind speeds
- The returned radiation is shifted in frequency by the
motion of the target
- This can be used to calculate drop speed along the
radial path
- This path is basically horizontal toward or away from
the radar
- Green = INBOUND; RED=OUTBOUND
SLIDE 19
Doppler Radar: Tornadic hook echo and velocity couplet
Doppler winds: only toward or away from radar http://www.spc.noaa.gov/coolimg/cape_may.htm
SLIDE 20
SLIDE 21
Lidar measurements of ice crystals falling on Mars?
SLIDE 22
Wind Profiler sample data