Ch 11/12: Manipulate, Facet timing presentation topic choices due - - PowerPoint PPT Presentation

ch 11 12 manipulate facet
SMART_READER_LITE
LIVE PREVIEW

Ch 11/12: Manipulate, Facet timing presentation topic choices due - - PowerPoint PPT Presentation

Today Presentation topic choices Ch 11/12: Manipulate, Facet timing presentation topic choices due this Friday (Oct 27) at noon presentation topics post your choice to discussion thread on Canvas: 1 or 2 topic choices Paper:


slide-1
SLIDE 1

www.cs.ubc.ca/~tmm/courses/547-17F

Ch 11/12: Manipulate, Facet Paper: Paramorama

Tamara Munzner Department of Computer Science University of British Columbia

CPSC 547, Information Visualization Week 7: 24 Oct 2017

Today

  • timing

–presentation topics –projects –meetings timing –proposal expectation walkthrough –team (or potential team) sync-ups –today’s reading discussion, Q&A –break –Matt Brehmer guest lecture 3:30 –Timelines Revisited –ChartAccent –tools discussion

2

Presentations & Projects

3

Presentation topic choices

  • presentation topic choices due this Friday (Oct 27) at noon

–post your choice to discussion thread on Canvas: 1 or 2 topic choices

  • ok to have more than one person with same choice

–timing: let me know if a specific day is bad for you (“veto day”)

  • from this set: Nov 7, 14, 21, 28, Dec 5

–I’ll assign days soon –I’ll assign papers (from this year’s VIS conf) at least 1 week before your presentation –more on presentation expectations next time (Oct 31)

4

Presentation topics: Pick one or two

  • data types

– networks – trees – geographic data – high-dimensional data – text data – space & time (spatiotemporal data) – trajectories – sequences & events – multi-attribute tables – spatial fields

  • domains

– machine learning – genomics – medicine – sports – digital humanities – sense making

  • topics

– color – design – perception – uncertainty – analysis process

  • techniques

– parallel coordinates – dimensionality reduction – clustering – matrix views – multiple view coordination

5

Groups

  • finalize by this Fri Oct 27 at latest

–post to project matchup thread on discussion board to confirm your group –please post with current status report, even before that!

  • who’s still looking, who’s resolved

6

Meetings

  • each group needs signoff: at least one meeting

–in some cases followup meeting needed; in some cases you’re already set

  • meetings cutoff is 5pm Thu Nov 2
  • major blocks of available time

–Tue 10/24 5-6 –Wed 10/25 4-6:30 –Thu 10/26 3:30-6:30 –Fri 10/27 5-6 –Mon 10/30 flexible all day –Tue 10/31 5-7 –Wed 11/1 5:30-6:30 –The 11/2 3:30-5

7

Projects overall schedule

  • Pitches: Tue Oct 17 in class
  • Groups finalized: Fri Oct 27 5pm
  • Meetings cutoff: Thu Nov 2 at 5pm
  • Proposals due: Mon Nov 5 at 10pm

–(no readings due Tue Nov 6)

  • Peer Project Reviews 1: Tue Nov 20 in class
  • Peer Project Reviews 2: Tue Dec 5 in class
  • Final presentations: Tue Dec 12 1-5pm
  • Final papers due: Fri Dec 15 at 11:59pm

8

Proposals

  • projects: written proposals due Mon Nov 5 10pm

–(no readings due Tue Nov 6)

  • heading

–project title (real title, not just “CPSC 547 proposal” - can change later) –name & email of every person on team (do not include student numbers)

  • intro: brief description of what you're proposing to do, at high level

–include personal expertise in this area (for each group member)

  • for design studies: domain, data, task

–definitely in domain terms –get started on abstraction (even if preliminary)

  • do discuss scale of data: # items, # levels in each categorical attrib, range of ordered attribs
  • for technique projects: explain proposed context of use

9

Proposals II

  • proposed infovis solution (what you know so far)

–do include illustration of what interface might look like, could be hand drawn sketch

  • r mockup made with drawing program

–do include scenario of use (how user would use solution to address task)

  • implementation plan (high-level: platform, language, libraries)

–clarify your scope/goal: building on work of others to enable more ambitious project, vs rolling your own to learn tool. amount of work depends on your existing expertise

  • milestones

–break into meaningful smaller pieces. specific to your project, in addition to generic –for each, estimate target date of completion and hours of work –be explicit about who will do what: work breakdown between group members –time scope: 70 hrs per person across whole project –very typical to structure as possibilities: after A&B, decide on C and do 2 of D-G

10

Proposals III

  • http://www.cs.ubc.ca/~tmm/courses/547-17F/projectdesc.html#proposals
  • also, consult final report structure to have future goal in mind


http://www.cs.ubc.ca/~tmm/courses/547-17F/projectdesc.html#final

11

Paper: Paramorama

12

Paramorama: Visualization of Parameter Space for Image Analysis

  • requirements

–R1 separate out specification of input params and inspection of output

  • from slow computations (actual image processing)

–R2 enable param optimization. three classes of params, focus on hard ones:

  • aliases: input once, never change, minimal effort
  • nominal params: pick from list, never change, minimal effort
  • continuous params: essential to find right thresholds; difficult & time consuming

– only 3-7 out of the 5-20 total params need to be carefully sampled

–R3 analyze outcomes for reference image wrt input params: find good vs bad

  • strategy

–offline batch processing to compute, then interactive exploration of output –user selects module, subset of continuous params, range, and target # samples

13

[Visualization of Parameter Space for Image Analysis. Pretorius, Ruddle, Bray, Carpenter. TVCG 12(17):2402-2411 2011 (Proc. InfoVis 2011). ]

Data

  • data: samples & output

–CellProfiler full pipeline has150-200 params –10-20 modules w/ 5-20 params each

  • derived data: table

–rows are unique combos of sampled param values –columns are user-selected params

  • derived data: hierarchical clustering

–root contains all tuples –each level represents user-selected parameter –path from the root to each leaf represents unique combination of sampled parameter –reorder parameters to change leaf order

  • instead of reorder columns in table

14

Overview

  • cluster hierarchy of sampled params
  • primary navigation control

–user selects areas, linked highlighting in refinement view

  • visual encoding spatial position: rectilinear node-link view

–considerations: compactness, linear ordering, skinny aspect ratio –rejected: icicle plots & tree maps vs node-link –rejected: radial vs rectilinear

  • vis enc: color

–perceptually ordered, colourblind-safe –luminance high, saturation low

15

[Fig 4. Visualization of Parameter Space for Image Analysis. Pretorius, Ruddle, Bray, Carpenter. TVCG 12(17):2402-2411 2011 (Proc. InfoVis 2011). ]

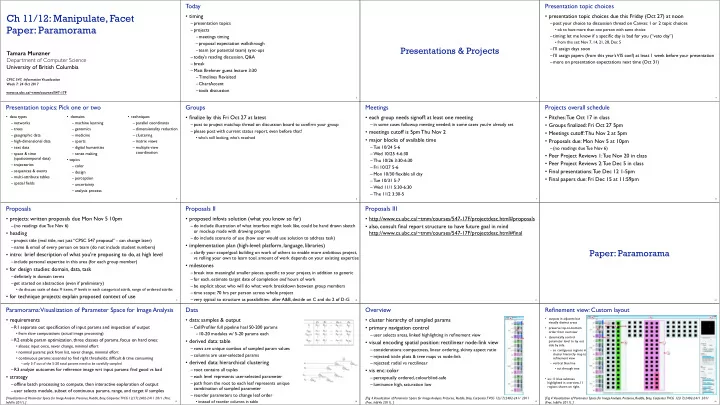
Refinement view: Custom layout

  • outputs in adjacent but

visually distinct areas

  • preserve top-to-bottom
  • rder from overview
  • dynamically control

parameter level to lay out side by side – so contiguous regions in cluster hierarchy map to refinement view – vertical blue line

  • cut through tree
  • ex: 11 blue subtrees

highlighted in overview, 11 regions shown on right.

16

[Fig 4. Visualization of Parameter Space for Image Analysis. Pretorius, Ruddle, Bray, Carpenter. TVCG 12(17):2402-2411 2011 (Proc. InfoVis 2011). ]

slide-2
SLIDE 2

Interaction

  • multiple views w/ 3 scales
  • overview
  • mid-level refinement
  • detail view for

selected single image (top right)

  • shortcut: next

unselected subtree

  • linked highlighting
  • selection blue
  • focus red
  • tagging: good (green) vs

bad (magenta)

  • filtering: range or tags
  • detail text view on control

panel not popups

17

[Fig 4. Visualization of Parameter Space for Image Analysis. Pretorius, Ruddle, Bray, Carpenter. TVCG 12(17):2402-2411 2011 (Proc. InfoVis 2011). ]

Case study: novice user

  • speed: 10 min to find contiguous part of parameter space that yields high-quality results

18

[Fig 6. Visualization of Parameter Space for Image Analysis. Pretorius, Ruddle, Bray, Carpenter. TVCG 12(17):2402-2411 2011 (Proc. InfoVis 2011). ]

Case study: expert user

  • quality: higher quality result from considering over 3K images

19

[Fig 7. Visualization of Parameter Space for Image Analysis. Pretorius, Ruddle, Bray, Carpenter. TVCG 12(17):2402-2411 2011 (Proc. InfoVis 2011). ]

Ch 10: Manipulate

20 21

Encode Arrange Express Separate Order Align Use Manipulate Facet Reduce Change Select Navigate Juxtapose Partition Superimpose Filter Aggregate Embed

How? Encode Manipulate Facet

Map Color Motion Size, Angle, Curvature, ...

Hue Saturation Luminance

Shape

Direction, Rate, Frequency, ...

from categorical and ordered attributes

How to handle complexity: 1 previous strategy + 3 more

22

Manipulate Facet Reduce Change Select Navigate Juxtapose Partition Superimpose Filter Aggregate Embed Derive

  • derive new data to

show within view

  • change view over time
  • facet across multiple

views

  • reduce items/attributes

within single view

23

Manipulate

Navigate Item Reduction

Zoom Pan/Translate Constrained Geometric or Semantic

Attribute Reduction

Slice Cut Project

Change over Time Select

Change over time

24

  • change any of the other choices

–encoding itself –parameters –arrange: rearrange, reorder –aggregation level, what is filtered... –interaction entails change

25

Idiom: Re-encode

made using Tableau, http://tableausoftware.com

System: Tableau Idiom: Change parameters

  • widgets and controls

–sliders, buttons, radio buttons,
 checkboxes, 
 dropdowns/comboboxes

  • pros

–clear affordances,
 self-documenting (with labels)

  • cons

–uses screen space

  • design choices

–separated vs interleaved

  • controls & canvas

26

[Growth of a Nation](http://laurenwood.github.io/) slide inspired by: Alexander Lex, Utah

Idiom: Change order/arrangement

27

  • what: simple table
  • how: data-driven reordering
  • why: find extreme values, trends

[Sortable Bar Chart](https://bl.ocks.org/mbostock/3885705)

Idiom: Reorder

28

  • what: table with many attributes
  • how: data-driven reordering by selecting column
  • why: find correlations between attributes

System: DataStripes

[http://carlmanaster.github.io/datastripes/]

Idiom: Change alignment

29

  • stacked bars

–easy to compare

  • first segment
  • total bar
  • align to different segment

–supports flexible comparison

System: LineUp

[LineUp: Visual Analysis of Multi-Attribute Rankings.Gratzl, Lex, Gehlenborg, Pfister, and Streit. IEEE Trans. Visualization and Computer Graphics (Proc. InfoVis 2013) 19:12 (2013), 2277–2286.]

Shiny example

  • APGI genome browser

–tooling: R/Shiny –interactivity

  • tooltip detail on demand
  • n hover
  • expand/contract

chromosomes

  • expand/contract control

panes

30

https://gallery.shinyapps.io/genome_browser/

Idiom: Animated transitions

  • smooth interpolation from one state to another

–alternative to jump cuts, supports item tracking –best case for animation –staging to reduce cognitive load

  • example: animated transitions in statistical data graphics


video: vimeo.com/19278444

31

[Animated Transitions in Statistical Data Graphics. Heer and Robertson. IEEE TVCG (Proc InfoVis 2007) 13(6):1240-1247, 2007]

Idiom: Animated transitions - visual encoding change

32

[Stacked to Grouped Bars](http://bl.ocks.org/mbostock/3943967)

  • smooth transition from one state to another

–alternative to jump cuts, supports item tracking –best case for animation –staging to reduce cognitive load

slide-3
SLIDE 3

Idiom: Animated transition - tree detail

  • animated transition

–network drilldown/rollup

33

[Collapsible Tree](https://bl.ocks.org/mbostock/4339083)

Idiom: Animated transition - bar detail

  • example: hierarchical bar chart

–add detail during transition to new level of detail

34

[Hierarchical Bar Chart](https://bl.ocks.org/mbostock/1283663)

Interaction technology

  • what do you design for?

–mouse & keyboard on desktop?

  • large screens, hover, multiple clicks

–touch interaction on mobile?

  • small screens, no hover, just tap

–gestures from video / sensors?

  • ergonomic reality vs movie bombast

–eye tracking?

35

www.youtube.com/watch?v=QXLfT9sFcbc I Hate Tom Cruise - Alex Kauffmann (5 min)

slide inspired by: Alexander Lex, Utah

vimeo.com/182590214 Data visualization and the news - Gregor Aisch (37 min)

Selection

  • selection: basic operation for most interaction
  • design choices

–how many selection types?

  • interaction modalities
  • click/tap (heavyweight) vs hover (lightweight but not available on most touchscreens)
  • multiple click types (shift-click, option-click, …)
  • proximity beyond click/hover (touching vs nearby vs distant)
  • application semantics

– adding to selection set vs replacing selection – can selection be null? – ex: toggle so nothing selected if click on background – primary vs secondary (ex: source/target nodes in network) – group membership (add/delete items, name group, …)

36

Select

Highlighting

  • highlight: change visual encoding for selection targets

–visual feedback closely tied to but separable from selection (interaction)

  • design choices: typical visual channels

–change item color

  • but hides existing color coding

–add outline mark –change size (ex: increase outline mark linewidth) –change shape (ex: from solid to dashed line for link mark)

  • unusual channels: motion

–motion: usually avoid for single view

  • with multiple views, could justify to draw attention to other views

37

Select

Tooltips

  • popup information for selection

–hover or click –can provide useful additional detail on demand –beware: does not support overview!

  • always consider if there’s a way to visually encode directly to provide overview
  • “If you make a rollover or tooltip, assume nobody will see it. If it's important, make it explicit. “

– Gregor Aisch, NYTimes

38 39

Manipulate

Navigate Item Reduction

Zoom Pan/Translate Constrained Geometric or Semantic

Attribute Reduction

Slice Cut Project

Change over Time Select

Navigate: Changing viewpoint/visibility

  • change viewpoint

–changes which items are visible within view

  • camera metaphor

–pan/translate/scroll

  • move up/down/sideways

40

Navigate Item Reduction

Zoom Pan/Translate Geometric or Semantic

Idiom: Scrollytelling

  • how: navigate page by scrolling (panning down)
  • pros:

–familiar & intuitive, from standard web browsing –linear (only up & down) vs possible overload of click-based interface choices

  • cons:

–full-screen mode may lack affordances –scrolljacking, no direct access –unexpected behaviour –continuous control for discrete steps

41

https://eagereyes.org/blog/2016/the-scrollytelling-scourge [How to Scroll, Bostock](https://bost.ocks.org/mike/scroll/) slide inspired by: Alexander Lex, Utah

Scrollytelling examples

42

slide inspired by: Alexander Lex, Utah https://www.bloomberg.com/graphics/ 2015-whats-warming-the-world/ https://www.nytimes.com/interactive/2015/09/30/business/ how-the-us-and-opec-drive-oil-prices.html?_r=1

Navigate: Changing viewpoint/visibility

  • change viewpoint

–changes which items are visible within view

  • camera metaphor

–pan/translate/scroll

  • move up/down/sideways

–rotate/spin

  • typically in 3D

–zoom in/out

  • enlarge/shrink world == move camera closer/further
  • geometric zoom: standard, like moving physical object

43

Navigate Item Reduction

Zoom Pan/Translate Geometric or Semantic

Navigate: Unconstrained vs constrained

  • unconstrained navigation

–easy to implement for designer –hard to control for user

  • easy to overshoot/undershoot
  • constrained navigation

–typically uses animated transitions –trajectory automatically computed based on selection

  • just click; selection ends up framed nicely in final viewport

44

Navigate Item Reduction

Zoom Pan/Translate Constrained Geometric or Semantic

Idiom: Animated transition + constrained navigation

  • example: geographic map

–simple zoom, only viewport changes, shapes preserved

45

[Zoom to Bounding Box](https://bl.ocks.org/mbostock/4699541)

Idiom: Animated transition + constrained navigation

  • example: icicle plot

–transition into containing mark causes aspect ratio (shape) change

46

[Zoomable Icicle](https://bl.ocks.org/mbostock/1005873)

Idiom: Animated transition + constrained navigation

  • example: multilevel matrix views

–add detail during transition –movie: http://www.win.tue.nl/vis1/home/fvham/matrix/Zoomin.avi –movie: http://www.win.tue.nl/vis1/home/fvham/matrix/Zoomout.avi –movie: http://www.win.tue.nl/vis1/home/fvham/matrix/Pan.avi

47

[Using Multilevel Call Matrices in Large Software Projects. van Ham. Proc. IEEE Symp. Information Visualization (InfoVis), pp. 227–232, 2003.]

Idiom: Semantic zooming

  • semantic zoom

–alternative to geometric zoom –resolution-aware layout adapts to available space –goal: legible at multiple scales –dramatic or subtle effects

  • visual encoding change

–colored box –sparkline –simple line chart –full chart: axes and tickmarks

48

System: LiveRAC

[LiveRAC - Interactive Visual Exploration of System Management Time-Series Data. McLachlan, Munzner, Koutsofios, and North. Proc. ACM Conf. Human Factors in Computing Systems (CHI), pp. 1483–1492, 2008.]

slide-4
SLIDE 4

Navigate: Reducing attributes

  • continuation of camera metaphor

–slice

  • show only items matching specific value


for given attribute: slicing plane

  • axis aligned, or arbitrary alignment

–cut

  • show only items on far slide of plane 


from camera

–project

  • change mathematics of image creation

– orthographic (eliminate 3rd dimension) – perspective (foreshortening captures limited 3D information)

49

[Interactive Visualization of Multimodal Volume Data for Neurosurgical Tumor

  • Treatment. Rieder, Ritter, Raspe, and Peitgen. Computer Graphics Forum (Proc.

EuroVis 2008) 27:3 (2008), 1055–1062.]

Attribute Reduction

Slice Cut Project

Navigate: Cartographic projections

  • project from 2D sphere surface to 2D plane

–can only fully preserve 2 out of 3

  • angles: conformal
  • area: equal area
  • contiguity: no interruptions

50

[Every Map Projection](https://bl.ocks.org/mbostock/ 29cddc0006f8b98eff12e60dd08f59a7) https://www.jasondavies.com/maps/tissot/ https://www.win.tue.nl/~vanwijk/ myriahedral/

Interaction benefits

51

  • interaction pros

–major advantage of computer-based vs paper-based visualization –flexible, powerful, intuitive

  • exploratory data analysis: change as you go during analysis process
  • fluid task switching: different visual encodings support different tasks

–animated transitions provide excellent support

  • empirical evidence that animated transitions help people stay oriented

Interaction limitations

52

  • interaction has a time cost

–sometimes minor, sometimes significant –degenerates to human-powered search in worst case

  • remembering previous state imposes cognitive load

–rule of thumb: eyes over memory

  • hard to compare visible item to memory of what you saw
  • ex: maintaining context/orientation when navigating
  • ex: tracking complex changes during animation
  • controls may take screen real estate

–or invisible functionality may be difficult to discover (lack of affordances)

  • users may not interact as planned by designer

–NYTimes logs show ~90% don’t interact beyond scrollytelling - Aisch, 2016

Ch 11: Facet

53

Facet

54

Juxtapose Partition Superimpose

Juxtapose and coordinate views

55

Share Encoding: Same/Difgerent Share Data: All/Subset/None Share Navigation

Linked Highlighting

Idiom: Linked highlighting

56

System: EDV

  • see how regions contiguous in one

view are distributed within another –powerful and pervasive interaction idiom

  • encoding: different

–multiform

  • data: all shared
  • aka: brushing and linking

[Visual Exploration of Large Structured Datasets.

  • Wills. Proc. New

Techniques and Trends in Statistics (NTTS), pp. 237–246. IOS Press, 1995.]

Linked views

  • unidirectional vs bidirectional linking

57

http://www.ralphstraumann.ch/projects/swiss-population-cartogram/ http://peterbeshai.com/linked-highlighting-react-d3-reflux/

Linked views: Multidirectional linking

58

http://buckets.peterbeshai.com/

https://medium.com/@pbesh/linked-highlighting-with-react-d3-js-and-reflux-16e9c0b2210b

System: Buckets Video: Visual Analysis of Historical Hotel Visitation Patterns

59

http://www.cs.ou.edu/~weaver/improvise/examples/hotels/ https://www.youtube.com/watch?v=Tzsv6wkZoiQ

Complex linked multiform views

https://www.youtube.com/watch?v=aZF7AC8aNXo

60

System: Pathfinder Idiom: Overview-detail views

61

  • encoding: same
  • data: subset shared
  • navigation: shared

–bidirectional linking

  • differences

–viewpoint –(size)

  • special case:


birds-eye map

System: Google Maps

[A Review of Overview+Detail, Zooming, and Focus+Context Interfaces. Cockburn, Karlson, and Bederson. ACM Computing Surveys 41:1 (2008), 1–31.]

Idiom: Overview-detail navigation

  • encoding: same
  • data: subset shared
  • navigation: shared

–unidirectional linking –select in small overview –change extent in large detail view

62

https://www.highcharts.com/ demo/dynamic-master-detail

https://bl.ocks.org/mbostock/34f08d5e11952a80609169b7917d4172

Overview-detail

  • multiscale: three viewing levels

–linked views –dynamic filtering –tooling: processing 
 (modern version: p5js.org)

63

System: MizBee

https://www.youtube.com/watch?v=86p7brwuz2g

Overview-detail

64

https://www.youtube.com/watch?v=UcKDbGqHsdE

System: StratomeX

slide-5
SLIDE 5

Idiom: Small multiples

  • encoding: same
  • data: none shared

–different attributes for node colors –(same network layout)

  • navigation: shared

65

System: Cerebral

[Cerebral: Visualizing Multiple Experimental Conditions on a Graph with Biological Context. Barsky, Munzner, Gardy, and Kincaid. IEEE Trans. Visualization and Computer Graphics (Proc. InfoVis 2008) 14:6 (2008), 1253–1260.]

Coordinate views: Design choice interaction

66

All Subset Same Multiform Multiform, Overview/ Detail None Redundant No Linkage Small Multiples Overview/ Detail

  • why juxtapose views?

–benefits: eyes vs memory

  • lower cognitive load to move eyes between 2 views than remembering previous state with

single changing view

–costs: display area, 2 views side by side each have only half the area of one view

67

Why not animation?

  • disparate frames and

regions: comparison difficult

–vs contiguous frames –vs small region –vs coherent motion of group

  • safe special case

–animated transitions

System: Improvise

68

[Building Highly-Coordinated Visualizations In Improvise.

  • Weaver. Proc. IEEE Symp. Information

Visualization (InfoVis), pp. 159–166, 2004.]

  • investigate power
  • f multiple views

–pushing limits on view count, interaction complexity –how many is ok?

  • open research

question

–reorderable lists

  • easy lookup
  • useful when

linked to other encodings

Partition into views

69

  • how to divide data between views

–split into regions by attributes –encodes association between items using spatial proximity –order of splits has major implications for what patterns are visible

  • no strict dividing line

–view: big/detailed

  • contiguous region in which visually

encoded data is shown on the display

–glyph: small/iconic

  • object with internal structure that arises

from multiple marks

Partition into Side-by-Side Views

Partitioning: List alignment

  • single bar chart with grouped bars

–split by state into regions

  • complex glyph within each region showing all

ages

–compare: easy within state, hard across ages

  • small-multiple bar charts

–split by age into regions

  • one chart per region

–compare: easy within age, harder across states

70

11.0 10.0 9.0 8.0 7.0 6.0 5.0 4.0 3.0 2.0 1.0 0.0 CA TK NY FL IL PA 65 Years and Over 45 to 64 Years 25 to 44 Years 18 to 24 Years 14 to 17 Years 5 to 13 Years Under 5 Years CA TK NY FL IL PA

5 11 5 11 5 11 5 11 5 11 5 11 5 11

Partitioning: Recursive subdivision

  • split by neighborhood
  • then by type
  • then time

–years as rows –months as columns

  • color by price
  • neighborhood patterns

–where it’s expensive –where you pay much more for detached type

71

[Configuring Hierarchical Layouts to Address Research Questions. Slingsby, Dykes, and

  • Wood. IEEE

Transactions on Visualization and Computer Graphics (Proc. InfoVis 2009) 15:6 (2009), 977–984.]

System: HIVE Partitioning: Recursive subdivision

  • switch order of splits

–type then neighborhood

  • switch color

–by price variation

  • type patterns

–within specific type, which neighborhoods inconsistent

72

[Configuring Hierarchical Layouts to Address Research Questions. Slingsby, Dykes, and

  • Wood. IEEE

Transactions on Visualization and Computer Graphics (Proc. InfoVis 2009) 15:6 (2009), 977–984.]

System: HIVE Partitioning: Recursive subdivision

  • different encoding for

second-level regions

–choropleth maps

73

[Configuring Hierarchical Layouts to Address Research Questions. Slingsby, Dykes, and

  • Wood. IEEE

Transactions on Visualization and Computer Graphics (Proc. InfoVis 2009) 15:6 (2009), 977–984.]

System: HIVE Partitioning: Recursive subdivision

  • size regions by sale

counts

–not uniformly

  • result: treemap

74

[Configuring Hierarchical Layouts to Address Research Questions. Slingsby, Dykes, and

  • Wood. IEEE

Transactions on Visualization and Computer Graphics (Proc. InfoVis 2009) 15:6 (2009), 977–984.]

System: HIVE Superimpose layers

75

  • layer: set of objects spread out over region

–each set is visually distinguishable group –extent: whole view

  • design choices

–how many layers, how to distinguish?

  • encode with different, nonoverlapping channels
  • two layers achieveable, three with careful design

–small static set, or dynamic from many possible? Superimpose Layers

Static visual layering

  • foreground layer: roads

–hue, size distinguishing main from minor –high luminance contrast from background

  • background layer: regions

–desaturated colors for water, parks, land areas

  • user can selectively focus attention
  • “get it right in black and white”

–check luminance contrast with greyscale view

76

[Get it right in black and white. Stone. 2010. 
 http://www.stonesc.com/wordpress/2010/03/get-it-right-in-black-and-white]

Superimposing limits

  • few layers, but many lines

–up to a few dozen –but not hundreds

  • superimpose vs juxtapose: empirical study

–superimposed for local, multiple for global –tasks

  • local: maximum, global: slope, discrimination

–same screen space for all multiples vs single superimposed

77

[Graphical Perception of Multiple Time Series. Javed, McDonnel, and Elmqvist. IEEE Transactions

  • n

Visualization and Computer Graphics (Proc. IEEE InfoVis 2010) 16:6 (2010), 927–934.]

CPU utilization over time 100 80 60 40 20 05:00 05:30 06:00 06:30 07:00 07:30 08:00 05:00 05:30 06:00 06:30 07:00 07:30 08:00 100 80 60 40 20 05:00 05:30 06:00 06:30 07:00 07:30 08:00 100 80 60 40 20

Idiom: Trellis plots

  • superimpose within same frame

–color code by year

  • partitioning

–split by site, rows are wheat varieties

  • main-effects ordering

–derive value of median for group, use to order –order rows within view by variety median –order views themselves by site median

78

Dynamic visual layering

  • interactive based on selection
  • one-hop neighbour highlighting demos: click vs hover (lightweight)

79

http://mariandoerk.de/edgemaps/demo/ http://mbostock.github.io/d3/talk/20111116/airports.html